Gold (XAU/USD) Analysis
- Gold’s longer-term downtrend remains intact despite recent reprieve
- Real interest rates rise above 2%, denting gold’s appeal
- Gold’s bullish lift appears unconvincing – Jackson Hole up next
- The analysis in this article makes use of chart patterns and key support and resistance levels. For more information visit our comprehensive education library
Recommended by Richard Snow
How to Trade Gold
Gold’s Longer-Term Downtrend Remains Intact Despite Recent Reprieve
Gold remains within the descending channel but has found support ahead of $1875, turning higher this week as rising yields ease. With the Fed funds rate anticipated to remain elevated for longer, gold’s upside potential appears short-lived.
Gold Weekly Chart
Source: TradingView, prepared by Richard Snow
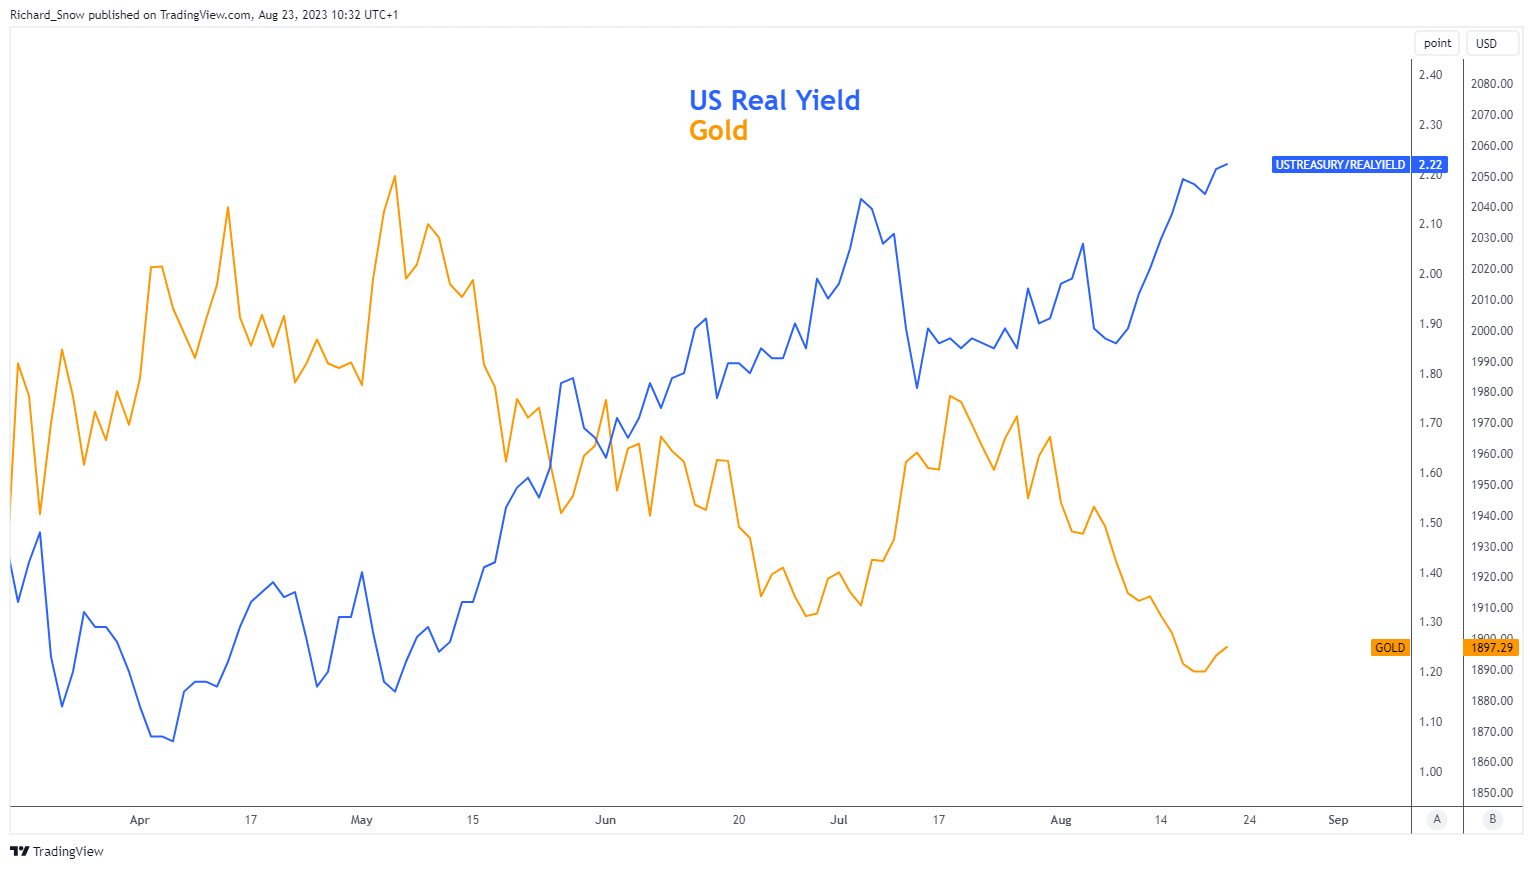
Real Interest Rates Rise Above 2%, Denting Gold’s Appeal
Rising risk-free rates like US treasuries, poses a challenge for the non-interest-bearing metal as traders can get a ‘risk-free’ rate of return that is on the rise. As such this has placed downward pressure on gold until this morning’s drop on the 10-year yield in particular. Gold has shown a strong negative correlation to US yields, as would be expected, and therefore we are seeing a short-term dip in the metal.
Gold vs US Real Yields

Source: TradingView, prepared by Richard Snow
Recommended by Richard Snow
Traits of Successful Traders
Gold’s Bullish Lift Appears Unconvincing
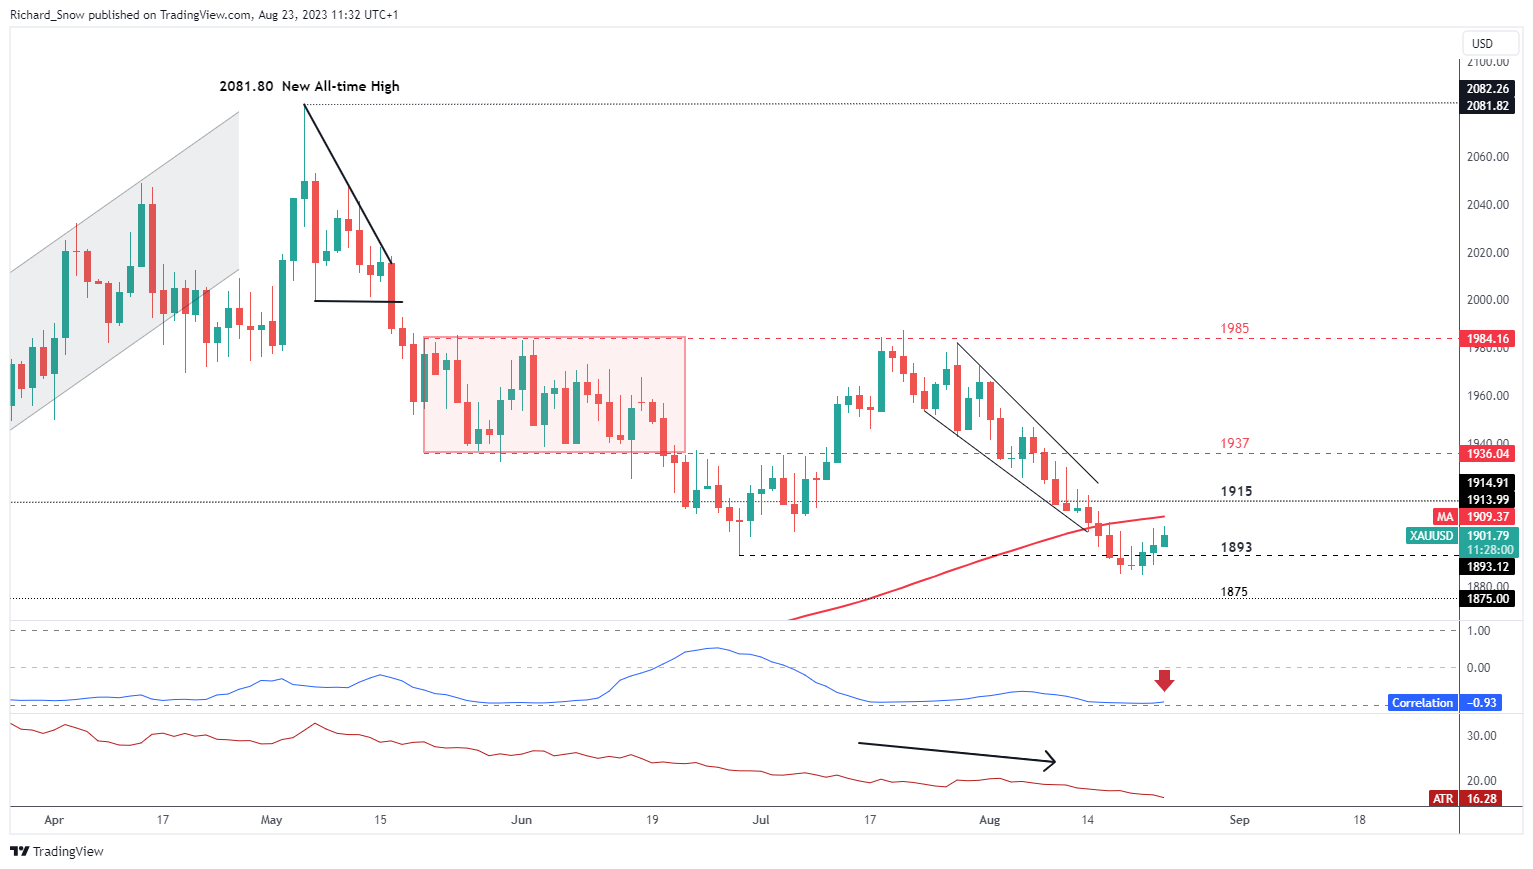
The daily chart shows that the precious metal is on track to post a third day of gains but technical indications raise doubts around an extended move higher. The recent lift in gold appears labored as upper wicks can be seen on the previous four daily candles, indicating a rejection of higher prices before each daily close. Generally speaking, countertrend moves require volatility and subsequent momentum to reverse near-term direction and the ATR indicator (brown line) below shows a steady decline in volatility.
The initial challenge to a potential bullish reversal appears at the $1915 level with $1937 warranting a reassessment of the medium-term bearish trend. However, a lack of bullish follow-through, lower volatility, and a very strong negative correlation to the elevated US 10-year yield (correlation coefficient nearing -1), gold maintains its bearish outlook.
Levels to the downside include the swing low at $1885, with the longer-term level of significance being $1875 for continued downside. Risks to the current gold outlook may arise later this week if Jerome Powell signals a more dovish path on interest rates but thus far has been careful not to give too much away given the unpredictable nature of inflation.
Gold Daily Chart

Source: TradingView, prepared by Richard Snow
See How Traders Use IG Client Sentiment
| Change in | Longs | Shorts | OI |
| Daily | 1% | 3% | 1% |
| Weekly | 2% | 11% | 3% |
Tomorrow evening marks the official start of the Jackson Hole Economic Symposium where the sharpest minds will present and discuss data around this year’s topic of ‘Structural Shifts in the Global Economy’. One of those shifts has been the breakdown in the inverse relationship between unemployment and the inflation rate as labor markets remain tight throughout inflation rise and recent decline.
— Written by Richard Snow for DailyFX.com
Contact and follow Richard on Twitter: @RichardSnowFX

Leave a Reply