US GDP Q3 ’23 (FINAL) KEY POINTS:
READ MORE: Bitcoin (BTC) Eyes a Fresh Multi-Month High, Solana (SOL) Continues to Outperform
Recommended by Zain Vawda
Trading Forex News: The Strategy
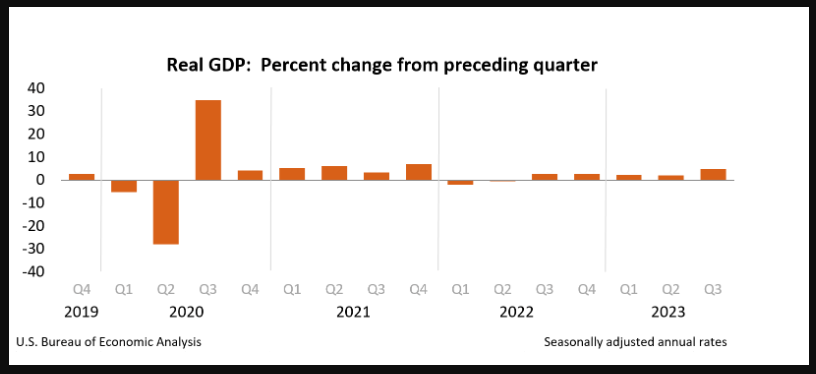
US Q3 GDP has been revised lower to 4.9%, slightly below 5.2% in the second estimate, but matching the 4.9% initially reported in the advance estimate. The estimate released today is based on more complete source data than were available for the “second” estimate issued last month. The downgrade primarily reflected a downward revision to consumer spending. Imports, which are a subtraction in the calculation of GDP, were revised down as well.
It is important to note though that the increase in real GDP (2.1% increase) reflected increases in consumer spending, private inventory investment, exports, imports, state and local government spending, federal government spending, residential fixed investment, and nonresidential fixed investment.
Customize and filter live economic data via our DailyFX economic calendar
It is important to note though that the increase in real GDP (2.1% increase) reflected increases in consumer spending, private inventory investment, exports, imports, state and local government spending, federal government spending, residential fixed investment, and nonresidential fixed investment.
Compared to the second quarter, the acceleration in real GDP in the third quarter primarily reflected an upturn in exports and accelerations in consumer spending and private inventory investment that were partly offset by a deceleration in nonresidential fixed investment. Imports turned up.

Source: US Bureau of Economic Analysis
PERSONAL INCOME
Current-dollar personal income increased $196.2 billion in the third quarter, a downward revision of $22.1 billion from the previous estimate. The increase in the third quarter primarily reflected increases in compensation which was led by private wages and salaries as the US labor market continues its resilience.
The most telling metric and something i have spoken about at length this year as US consumers continued to spend freely, was a drop off in disposable income in Q4. There are signs of this beginning but the robust labor market for now and salaries and wage growth are keeping consumer spending and disposable income supplemented.
Recommended by Zain Vawda
The Fundamentals of Range Trading
US ECONOMY MOVING FORWARD
The US economy has showed signs of a slowdown of late and todays data print just adds to the narrative. Fed rate cut expectations are likely to be dovishly repriced and if US Core PCE data underwhelms tomorrow this could leave the US Dollar under pressure heading into 2024.
Of course, such repricing is going to continue on a per data release basis, but the signs of a slowdown are definitely growing. This will also rekindle recessionary fears, but initial jobless claims once again beat estimates. At this stage the Fed appear on their way to winning the fight against inflation but there remain external threats which could hamper the last bit of progress needed to get the Fed over the line and inflation below 2%.
MARKET REACTION
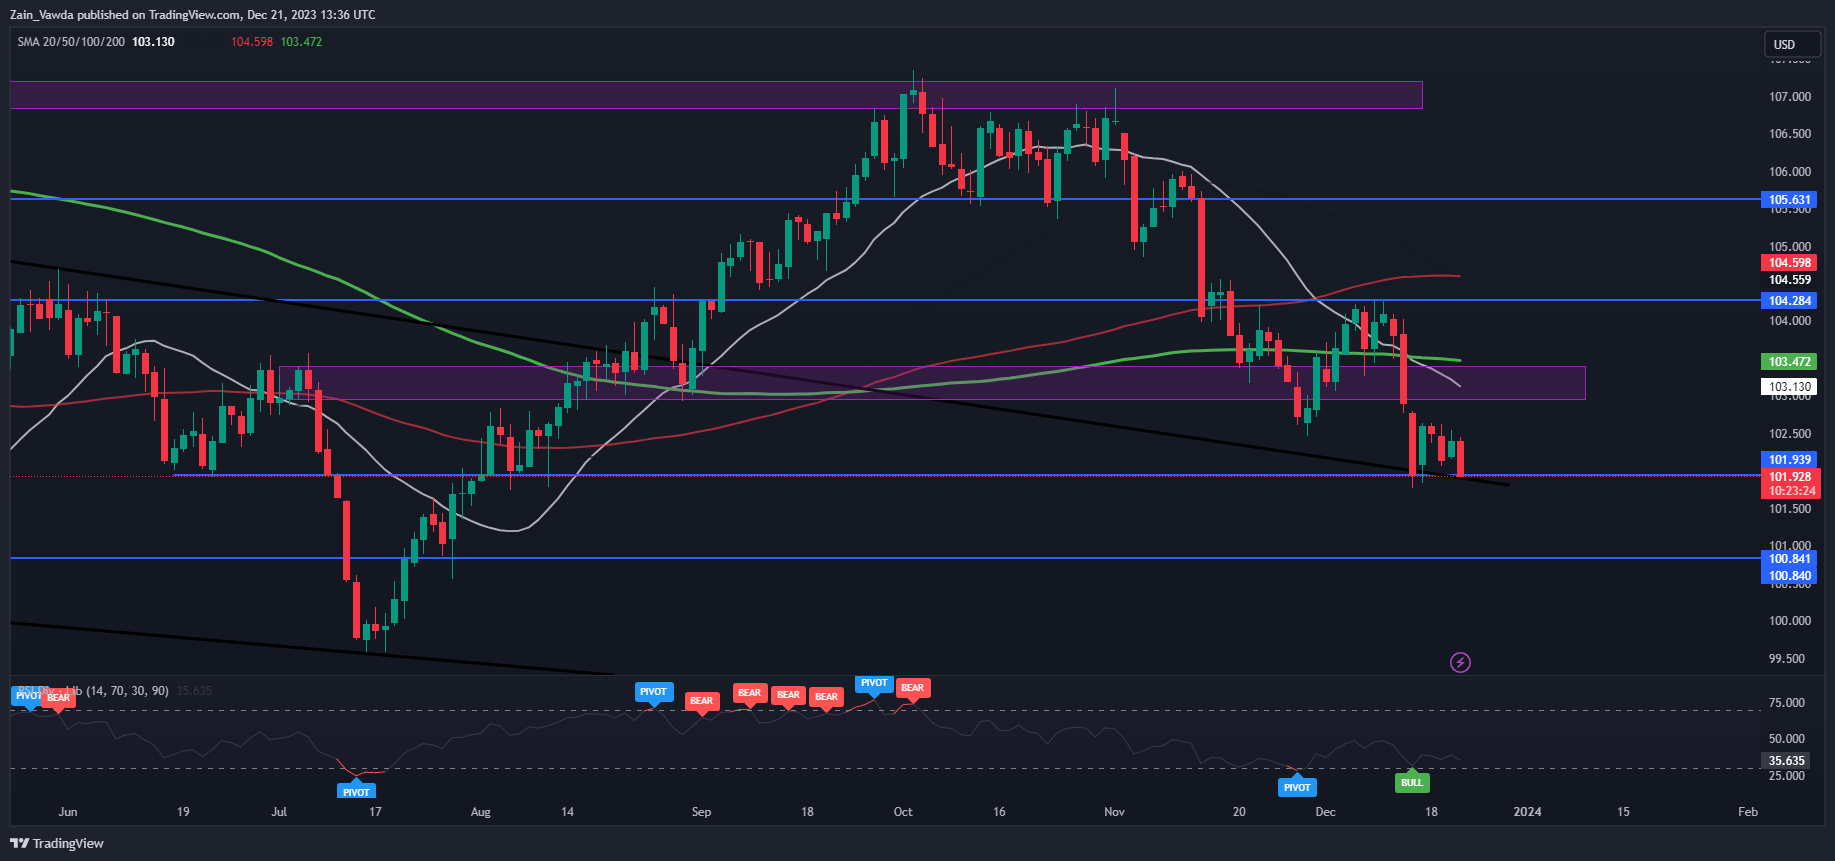
The initial market reaction following the news has seen the DXY continue its slide flirting with the most recent swing lows around the 101.75 handle. A break lower than that brings the support area around 100.84 into focus with US PCE Data out tomorrow this could leave the DXY vulnerable and a possible retest of the 100.00 psychological mark.
DXY Daily Chart, October 26, 2023

Source: TradingView, prepared by Zain Vawda
GOLD REACTION
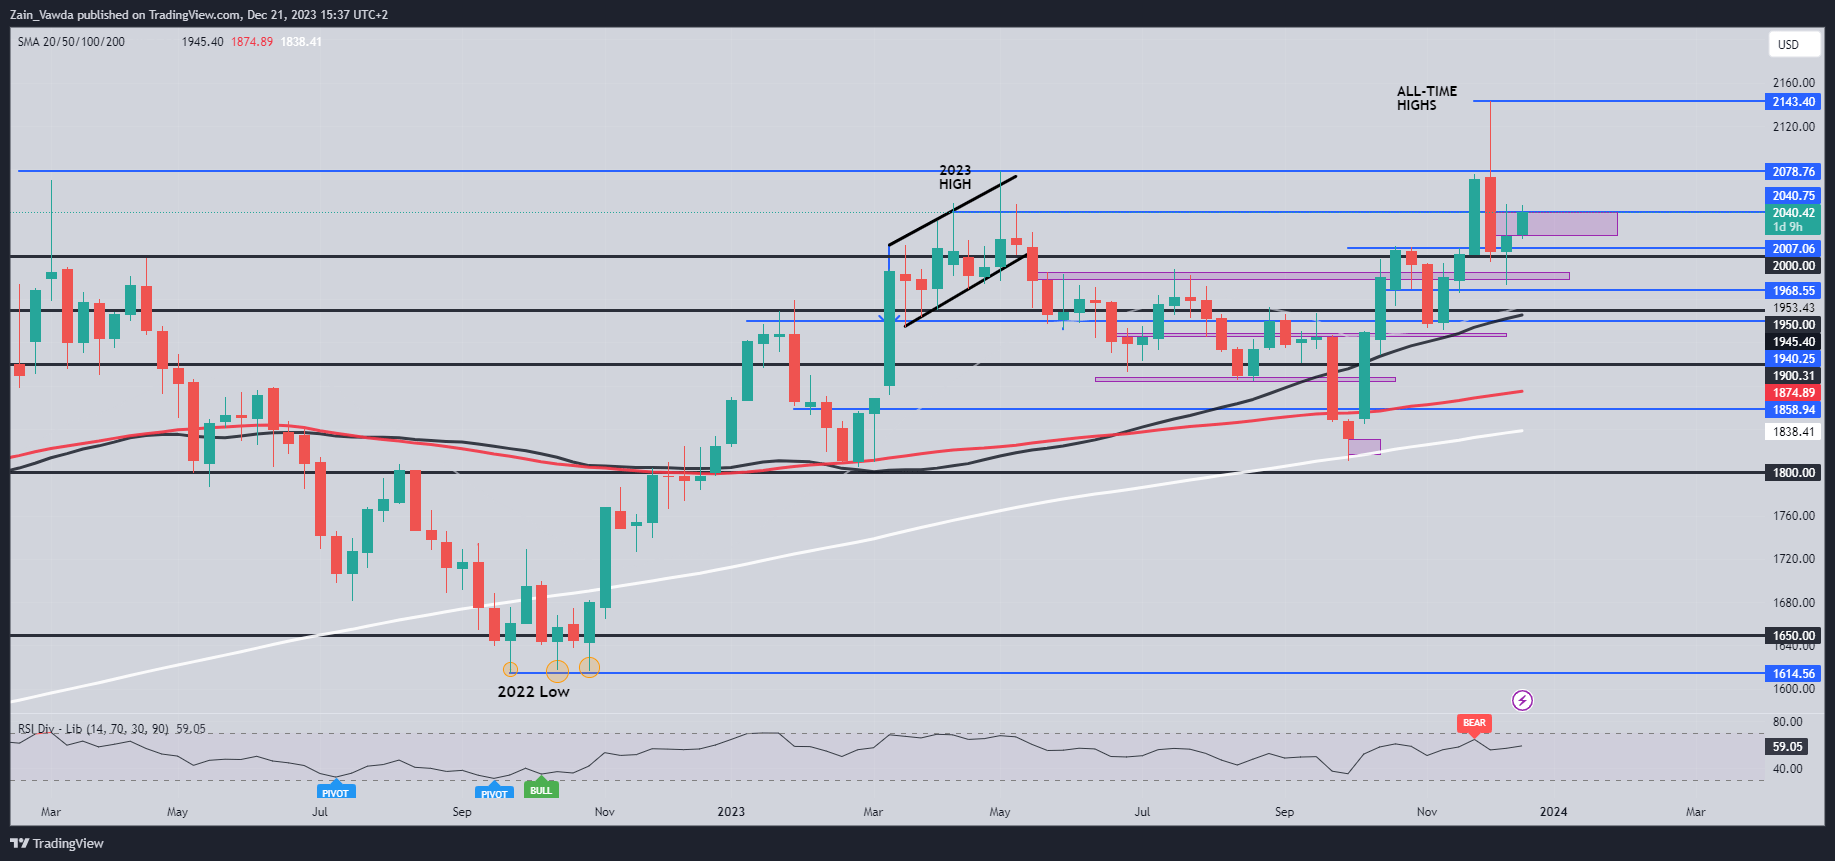
Gold continues to find support and has held the high ground for the majority of the week. However, as I mentioned earlier in the week in my Gold article upside beyond the $2050 remain elusive at this stage. Market participants may be looking at US PCE data out on Friday to provide a jolt of volatility which may spur on a bigger move. Right now, though the range between $2020-$2050 looks likely to hold.
XAU/USD Daily Chart, December 21, 2023

Source: TradingView, prepared by Zain Vawda
| Change in | Longs | Shorts | OI |
| Daily | -6% | 2% | -3% |
| Weekly | 2% | 6% | 3% |
— Written by Zain Vawda for DailyFX.com
Contact and follow Zain on Twitter: @zvawda

Leave a Reply