US CPI KEY POINTS:
Trade Smarter – Sign up for the DailyFX Newsletter
Receive timely and compelling market commentary from the DailyFX team
Subscribe to Newsletter
US headline inflation YoY in May declined to 4% beating estimates around 4.1% while Core CPI YoY remains rather sticky coming out in line with estimates at 5.3%. The headline YoY inflation print is the lowest since March 2021 and concludes 12 consecutive months of declines. The Core CPI which excludes volatile items such as food and energy has hit its lowest level since November 2021 but does remain rather sticky.
Customize and filter live economic data via our DailyFX economic calendar
The largest contributors to the decline in the headline figure did come from the energy index which declined 3.6 percent in May as the major energy component indexes fell. Food prices as mentioned above remain a real concern for the Federal Reserve with the index for food away from home up 8.3% over the past year and well above a level you would feel the Fed are comfortable with.

Source: US Bureau of Labor Statistics
FOMC MEETING TOMORROW AND THE OUTLOOK MOVING FORWARD
Heading into tomorrow’s meeting market pricing continues to lean toward a pause with today’s data likely to cement such a position. Core inflation remains sticky, however this could be the first signs for the Fed that the battle against inflation could be on the right track.
If this is the case the guidance provided by the Fed could be pivotal moving forward with market participants already seeing a greater probability of rate hikes at the July meeting. This came in the immediate aftermath of the meeting with rate hike probabilities rising as high 65% of a 25bps hike in July. Of course, today’s data is positive for the Federal Reserve in their fight against inflation, whether or not this will have any impact on tomorrow’s meeting and policy outlook moving forward remains to be seen.
MARKET REACTION
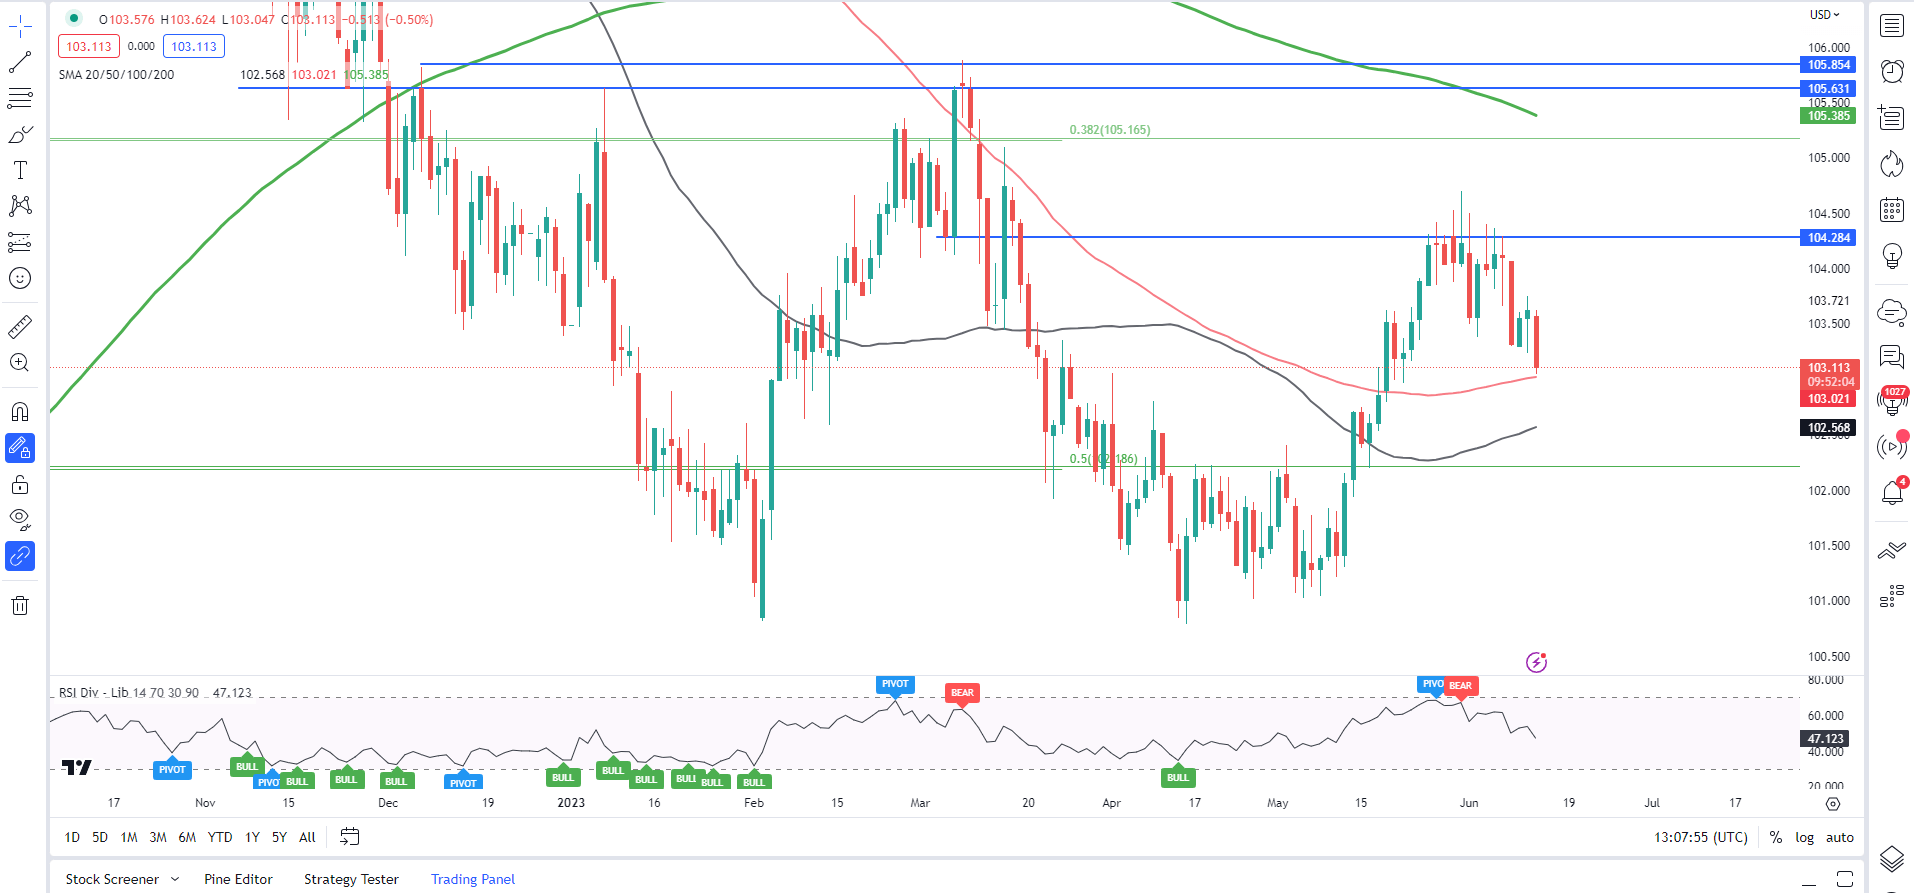
DXY Daily Chart

Source: TradingView, prepared by Zain Vawda
The DXY has been confined between the 103.30 and 104.30 handles as it looked for a new catalyst to inspire a breakout. Looking at the Dollar Index on the daily timeframe and we can see the key resistance area around the 104.30 which has held firm of late. Price has ticked higher on multiple occasions, but a daily candle close above has thus far failed to materialize.
Alternatively, a break below the 50 and 100-day MA could see a quick slide toward the 50-day MA and potentially lower. For now though the DXY remains in an overall uptrend without a daily candle close below the 101.00 handle.
Key Intraday Levels Worth Watching:
Support Areas
- 103.00 (100-day MA)
- 102.50 (50-day MA)
- 101.50
Resistance Areas
Recommended by Zain Vawda
Top Trading Lessons
— Written by Zain Vawda for DailyFX.com
Contact and follow Zain on Twitter: @zvawda

Leave a Reply