FTSE 100, DAX 40, and S&P 500 Analysis and Charts
Article written by IG Senior Market Analyst Axel Rudolph
Trade Smarter – Sign up for the DailyFX Newsletter
Receive timely and compelling market commentary from the DailyFX team
Subscribe to Newsletter
FTSE 100 approaches last week’s high
The FTSE 100 is making its third attempt at breaking above last week’s high at 7,660 despite UK house prices falling for the first time since 2012. A rise above 7,660 would put the mid-May low at 7,679 on the map.
Further up meanders the 55-day simple moving average (SMA) at 7,721 which may also be reached in the days to come.
Upside momentum should remain in play as long as Tuesday’s low at 7,555 isn’t being slid through on a daily chart-closing basis.
FTSE 100 Daily Price Chart – June 7, 2023
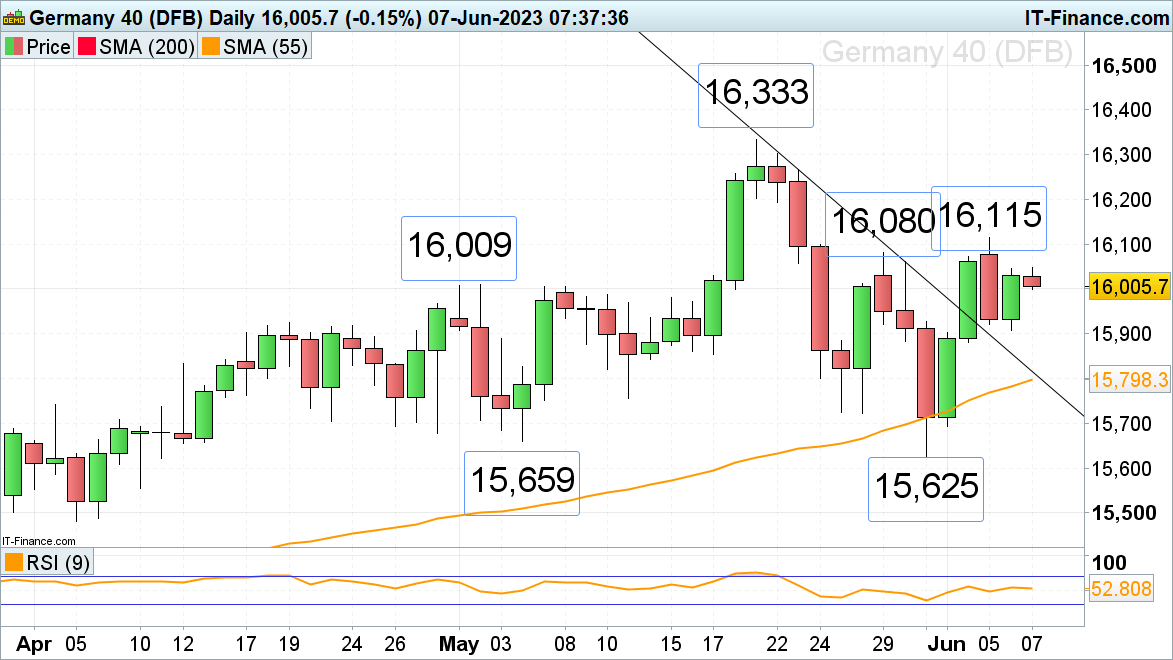
DAX 40 nears the late May high at 16,080
The DAX 40 is trying to reach a late May high at 16,080, following Monday’s bullish candlestick formation on the daily chart amid slight broad global risk-on sentiment.
A rise and daily chart close above the 16,080 high would target last week’s 16,115 high, above which lies the May all-time record high at 16,333.
Minor support sits around last Wednesday’s high and Tuesday’s low at 15,928 to 15,907. While it underpins, further upside may well be seen.
DAX 40 Daily Price Chart – June 7, 2023

Recommended by IG
Options for Beginners
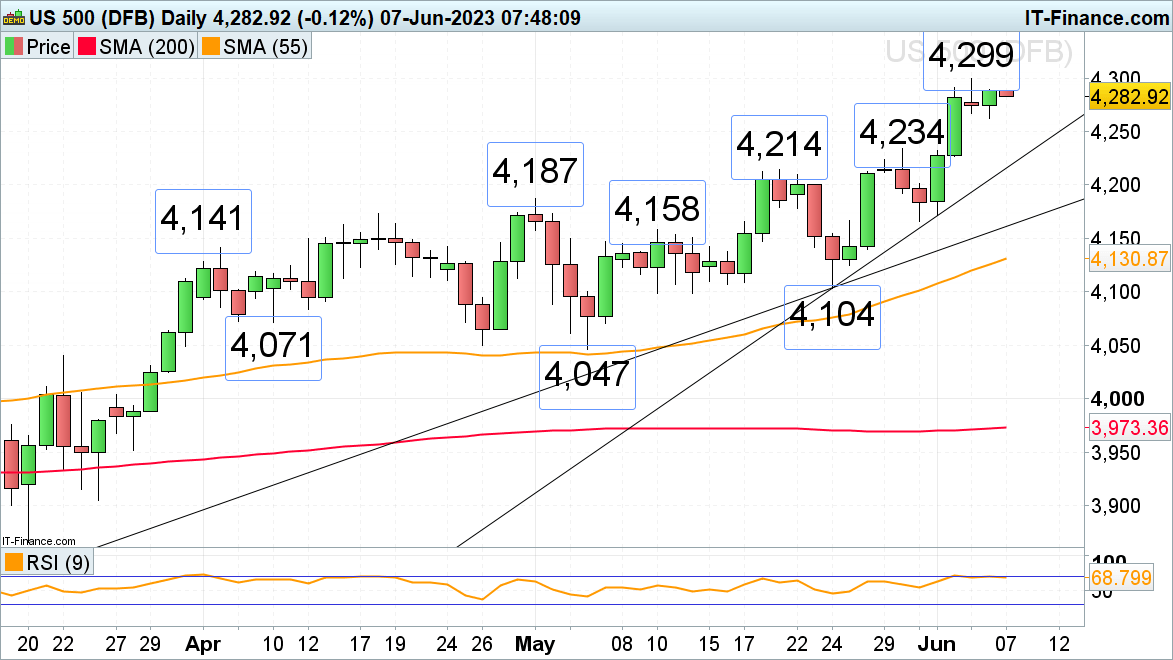
S&P 500 trades flirts with Monday’s nine-month high
On Monday, the S&P 500 rallied to a nine-month high at 4,299, close to its August 2022 peak at 4,325, both of which will remain in focus as long as risk-on sentiment prevails.
With more and more market players expecting the Fed not to raise rates at its June meeting, stock markets continue to look for a short-term bid.
Potential retracements should find minor support at Tuesday’s 4,262 low, below which sits far more significant support between the mid-to-late May highs at 4,234 to 4,214.
S&P 500 Daily Price Chart – June 7, 2023


Leave a Reply