Article written by IG Senior Market Analyst Axel Rudolph
FTSE 100, DAX 40, and S&P 500 Analysis and Charts
Trade Smarter – Sign up for the DailyFX Newsletter
Receive timely and compelling market commentary from the DailyFX team
Subscribe to Newsletter
FTSE 100 continues to be range bound
The FTSE 100 continues to sideways trade in a low volatility range as the British economy expands 0.2% in April, recovering from a 0.3% drop in March, and in line with expectations.
The technical levels to watch for a potential break out of the range are Tuesday’s 7,611 high and last week’s 7,546 low and the 200-day simple moving average (SMA) at 7,545. While Friday’s low at 7,546 underpins, the late May and current June highs at 7,655 to 7,660 may still be reached.
FTSE 100 Daily Price Chart – June 14, 2023
Recommended by IG
Traits of Successful Traders
DAX 40 ploughs ahead
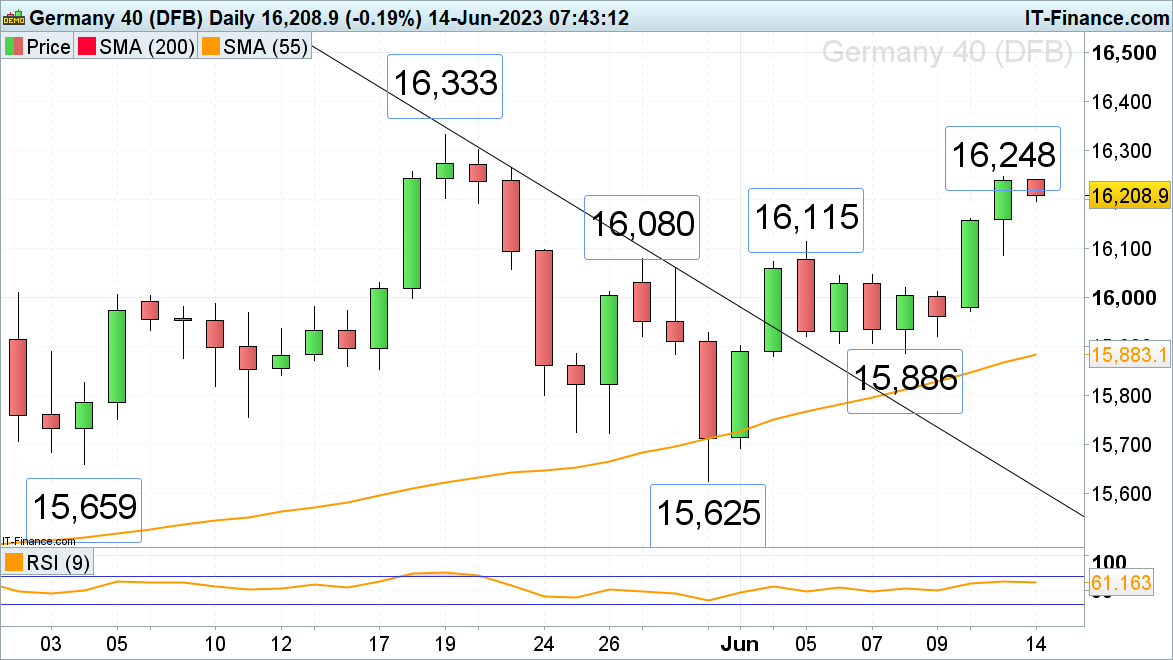
The DAX 40 is still trying to reach its May all-time high at 16,333 as German wholesale prices fall for a second straight month by 2.6% year-on-year in May.
For the all-time record high to be reached, Tuesday’s high at 16,248 needs to be overcome. Short-term it acts as resistance and as long as it does, a slip back towards Monday’s high at 16,161 may ensue ahead of today’s US Federal Open Market Committee (FOMC) June rate decision and Thursday’s European Central Bank (ECB) anticipated 25 basis-point rate hike.
DAX 40 Daily Price Chart – June 14, 2023

S&P 500 trades at levels last seen in April 2022
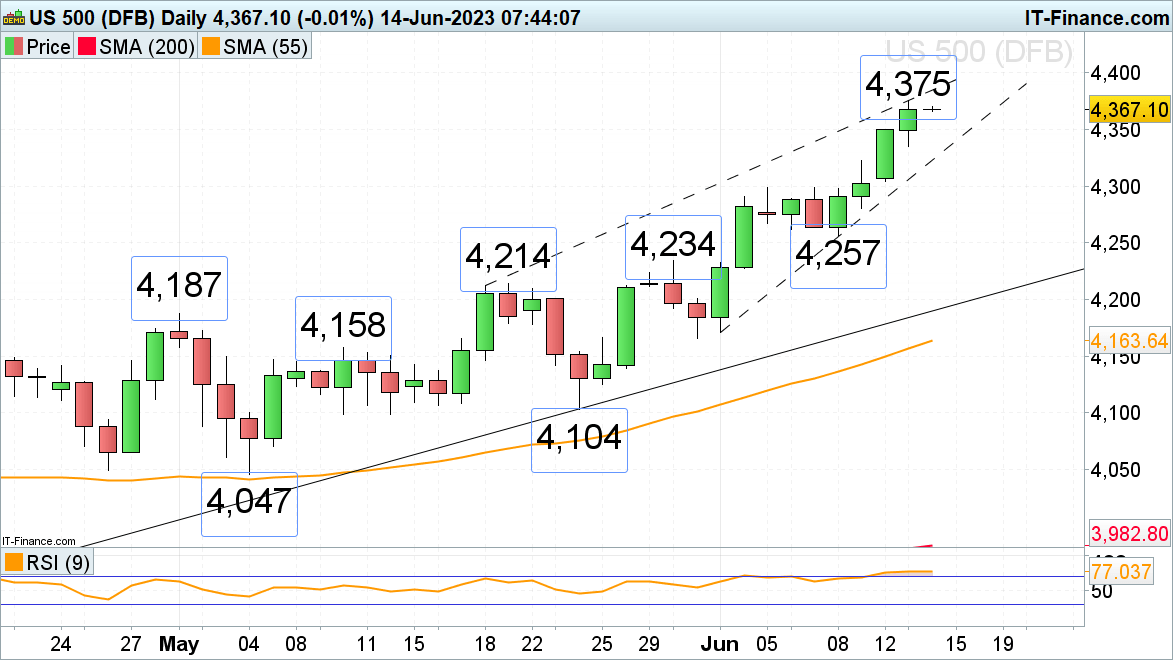
On Tuesday the S&P 500 rallied for a fourth consecutive day to its 14-month high at 4,375 ahead of Wednesday’s US Fed rate decision at which the central bank is widely expected not to hike its rates but rather do so in July. Above 4,375 lies the minor psychological 4,400 level and further up the 4,421 March 2022 peak. Slips should find support around the August 2022 peak at 4,325.
If not, a break out of a rising wedge formation could lead to a swift reversal to the downside if last Thursday’s 4,257 low were to be fallen through as well.
S&P 500 Daily Price Chart – June 14, 2023


Leave a Reply