Article by IG Senior Market Analyst Axel Rudolph
Nikkei 225, FTSE 100, S&P 500 Prices and Analysis
Initial Nikkei 225 Monday rally fizzles out
The Nikkei 225 began the day on a positive footing and rose to the 55-day simple moving average (SMA) at 32,415.9 as Japan Q3 business sentiment climbed the highest in five quarters before sellers regained the upper hand and pushed the index back down towards its 31,665.4 September low. It and the 25 August low at 31,563.2 may be revisited while the 55-day SMA caps. Were this level to give way in October, the August low at 31,251.2 would be eyed.
Immediate resistance sits around the 32,000 mark and further minor resistance at the 22 September low at 32,167.9, followed by the mid-September low and the 55-day SMA at 32,396.5 to 32,415.7.
Nikkei 225 Daily Chart
Download the Brand New Q4 Equity Outlook
Recommended by IG
Get Your Free Equities Forecast
FTSE 100 begins Q4 below its 200-day simple moving average (SMA)
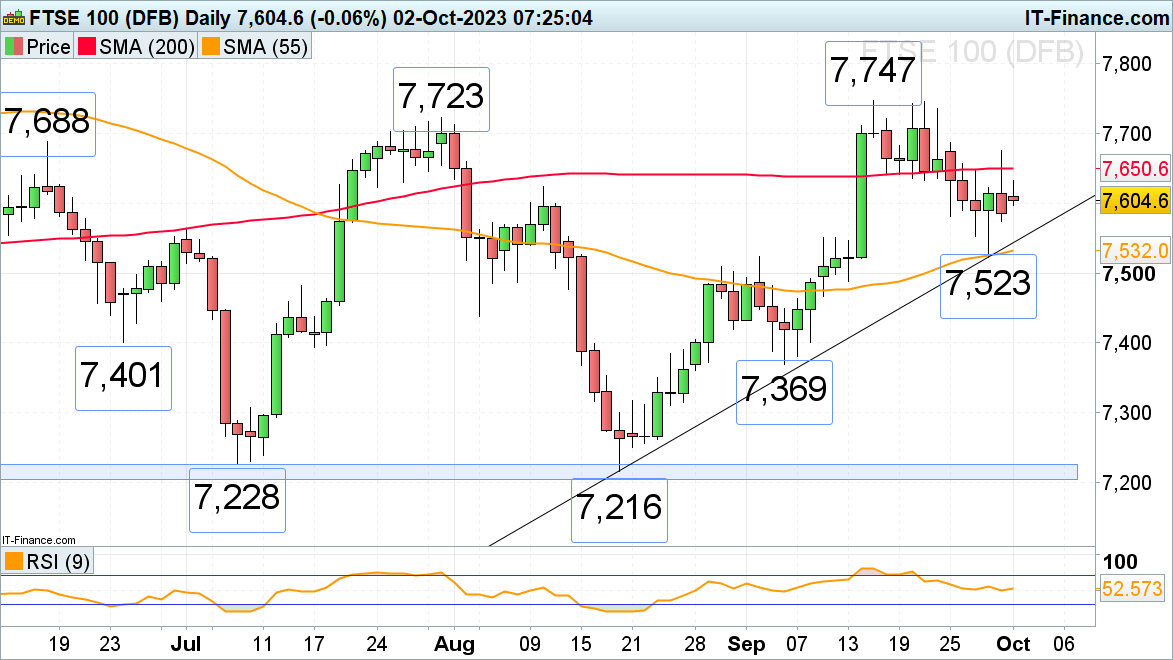
The FTSE 100 tried to stay above the 200-day simple moving average (SMA) at 7,650 on the last day of the third quarter but didn’t manage to do so and is beginning the last quarter of the year in a subdued mood. Resistance above the 200-day SMA can be spotted at Friday’s 7,675 high and the 7,688 June high. Further potential resistance comes in between the 7,723 July peak and the September high at 7,747. These highs will need to be exceeded for the psychological 7,800 mark and the 8 May high at 7,817 to be back in the frame.
Minor support sits at last Wednesday’s low at 7,553. Only a fall through last week’s low at 7,523 would open the door to the psychological 7,500 region.
FTSE100 Daily Chart

Recommended by IG
Building Confidence in Trading
S&P 500 mixed despite averted US government shutdown
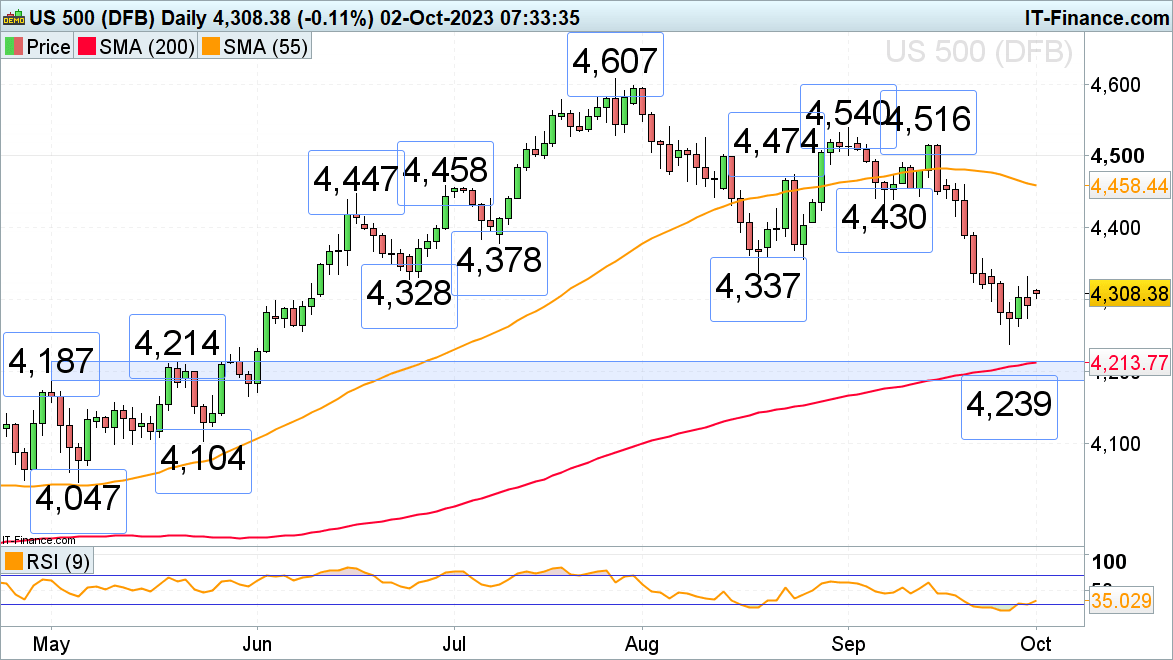
The S&P 500 begins the fourth quarter in a cautious mood despite US legislators agreeing to a temporary solution to keep the government open for 45 more days. A rise above not only Friday’s high at 4,332 needs to occur but also the late June to August lows at 4,328 to 4,337 for the 10 July low at 4,378 to be reached.
Slips should find support around Friday’s low at 4,274 ahead of the September low at 4,239. Below it lies the major 4,214 to 4,187 support zone which consists of the early and late May highs and the 200-day simple moving average (SMA).
S&P 500 Daily Chart

Recommended by IG
Traits of Successful Traders

Leave a Reply