The Cardano price has consistently remained below the $0.38 zone for the past two weeks, indicating a strong presence of sellers in the market. Despite attempts by buyers to regain strength over the past month, their efforts have been feeble, unable to overcome the bearish sentiment.
This persistent bearish price action has resulted in a notable breach of the crucial demand and support zone between $0.37 and $0.38.Over the last 24 hours, ADA has made a slight upward movement on its chart, but the progress has been limited.
Similarly, on the weekly chart, ADA has not shown significant advancement. The technical outlook for ADA reflects bearish pressure and a lack of buying strength.
Demand and accumulation remain low as a consequence. Many altcoins have indicated minor price increases, with Bitcoin returning to the $27,000 price. ADA must maintain trading above its immediate support line to break out of its current narrow trading range.
If ADA surpasses its overhead resistance, the altcoin could potentially experience a substantial rally in the following trading sessions. The decrease in ADA’s market capitalization suggests an increase in sellers outweighing buyers in the market.
Cardano Price Analysis: One-Day Chart
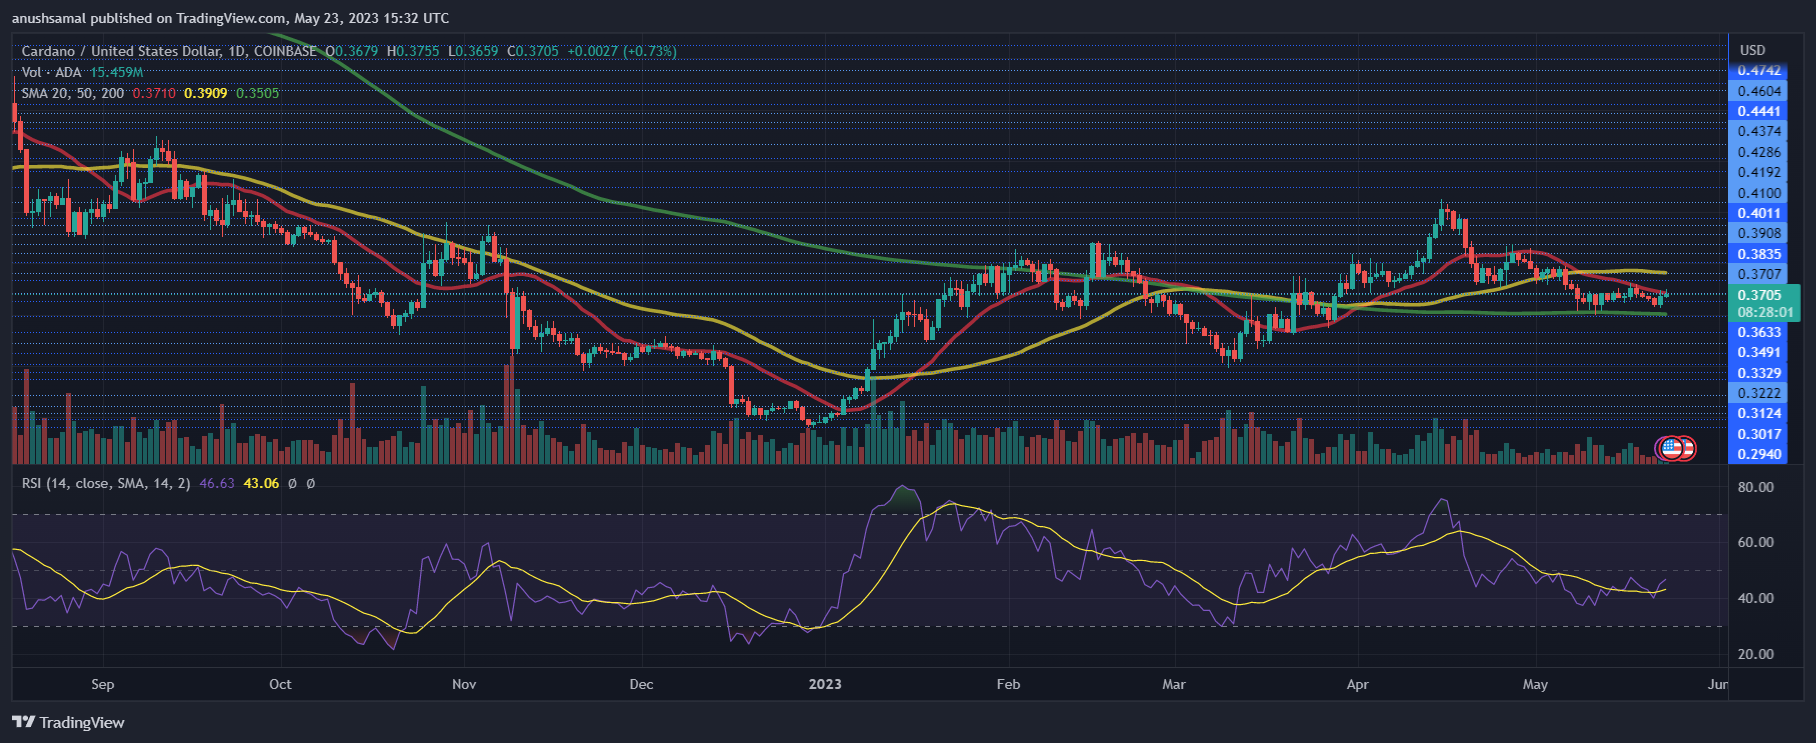
At the time of writing, the price of ADA was $0.37. The altcoin is currently experiencing tight price movement within a highly constricted range. Additionally, ADA is approaching a critical support level at $0.36.
On the upside, there is an overhead resistance at $0.38. A successful breakthrough above this level could drive ADA’s price toward $0.40.
However, if the price fails to sustain its current level, it could drop below $0.36. This would lead to a trading range near $0.34. The recent session showed a decrease in the amount of ADA traded, indicating a slow buying strength.
Technical Analysis

Throughout this month, ADA has struggled to generate substantial buying strength due to low demand. The Relative Strength Index (RSI) currently sits below the midpoint, signaling that selling pressure has prevailed in the market.
Furthermore, the altcoin price has recently dropped below the 20-Simple Moving Average (20-SMA) line, indicating that sellers have been driving the price momentum. For ADA to experience a breakout, the price would need to attempt to rise above the 20-SMA line.

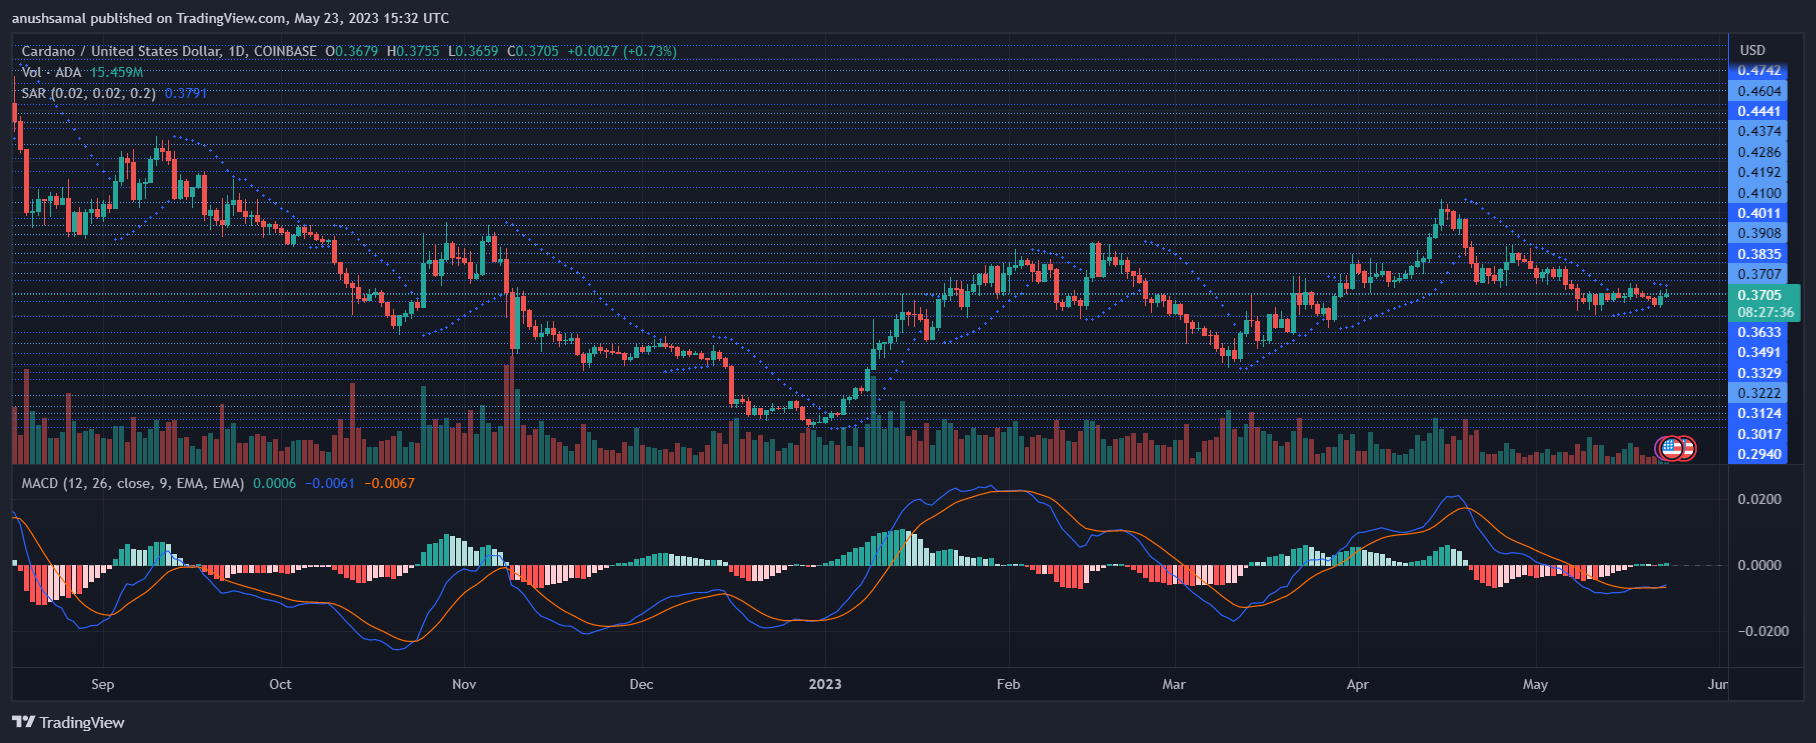
While other technical indicators may not signal ADA bullishness, the one-day chart reveals some buy signals. The Moving Average Divergence Convergence (MACD) has shown green histograms, indicating a positive price action and momentum.
However, the Parabolic SAR is yet to reflect this positive price action, as the dotted lines remain positioned above the price candlesticks.
Featured Image From UnSplash, Charts From TradingView.com

Leave a Reply