FTSE 100, Dow Jones, Dax 40 Analysis and Charts
FTSE 100 rebounds
The index has enjoyed two days of gains, recouping the losses suffered on Tuesday.Further gains target the 7700 high from early January, before moving on to the late December high at 7750. Having established a higher low this week, the bullish view begins to regain some strength, after a mixed performance in January and February.
A close back below 7540 and the 200-day simple moving average (SMA) would mark a more bearish development.
FTSE 100 Daily Chart
See the latest daily and weekly changes in FTSE 100 client sentiment
| Change in | Longs | Shorts | OI |
| Daily | -29% | 43% | -2% |
| Weekly | -28% | 30% | -5% |
Dax at new highs
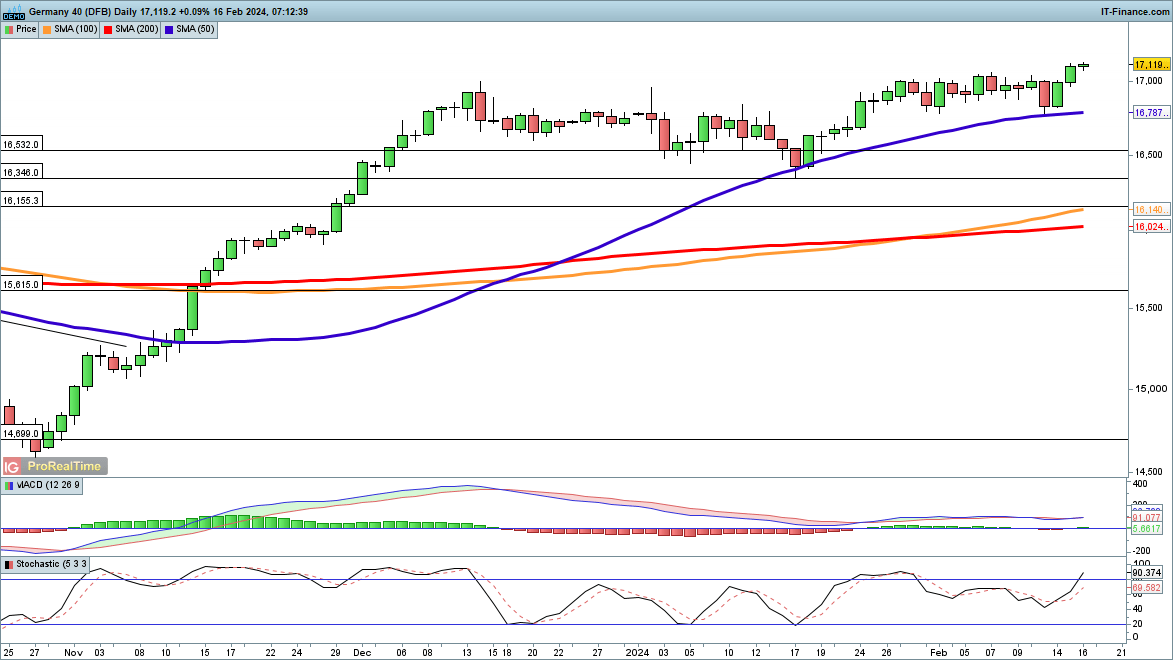
The consolidation of late January and early February has resolved into a move higher, with the index back above 17,000 and back at a new record high.The price has once again found support at the 50-day SMA, and looks poised for more upside.
A more bearish view would need a move back below the 50-day SMA to suggest another push towards the 16,532 and 16,346 areas of possible support.
DAX Daily Chart

Download our free guide on how to improve your trading confidence
Recommended by Chris Beauchamp
Building Confidence in Trading
Dow back on course for 39,000
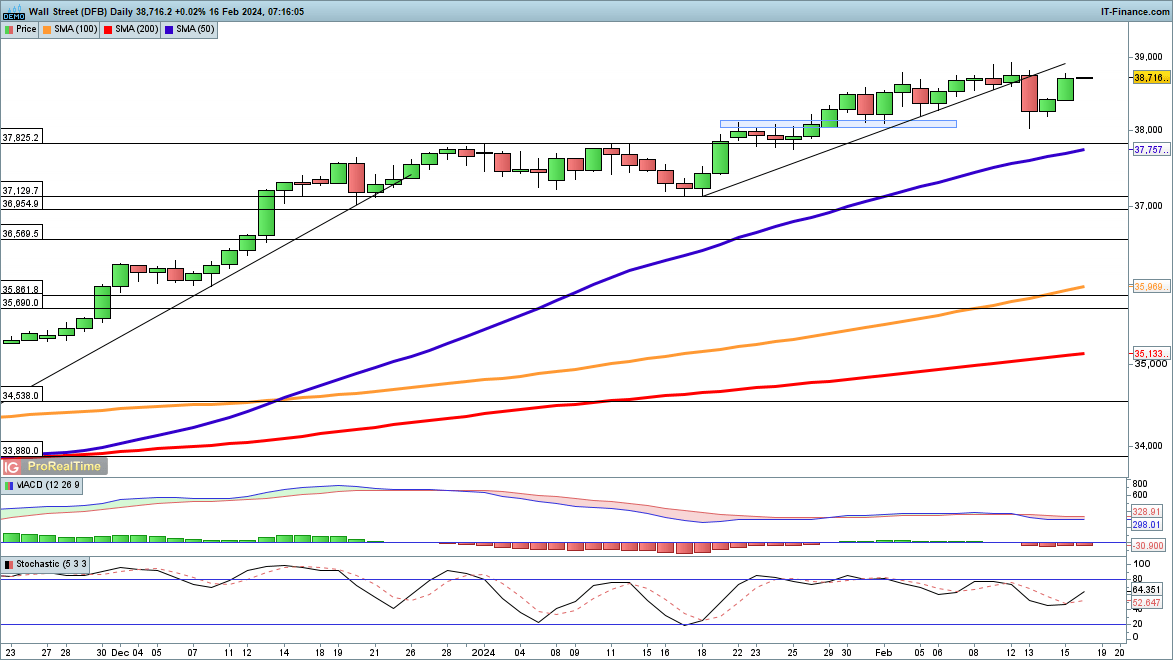
The index is heading higher again after a brief shakeout on Tuesday following US inflation data.Further gains will carry it back to new record highs, with 39,000 only a short distance away.
Sellers will need a reversal back below 38,000 to suggest a deeper pullback is at hand.
Dow Jones Daily Chart


Leave a Reply