Article by IG Chief Market Analyst Chris Beauchamp
FTSE 100, Dow Jones, Hang Seng Analysis and Charts
FTSE 100 under pressure again
The index has pushed lower in morning trading, moving back below 7500 once again.Yesterday saw the index recover from its lows, but it closed below the 50-day SMA. A fresh turn lower today bolsters the bullish view and suggests the 7440 level may be tested as support. Below this, the July lows at 7220 come into view.
Bulls will need a close back above 7550 to suggest that they have managed to reassert control.
FTSE 100 Daily Price Chart
Recommended by IG
Building Confidence in Trading
Dow slips lower
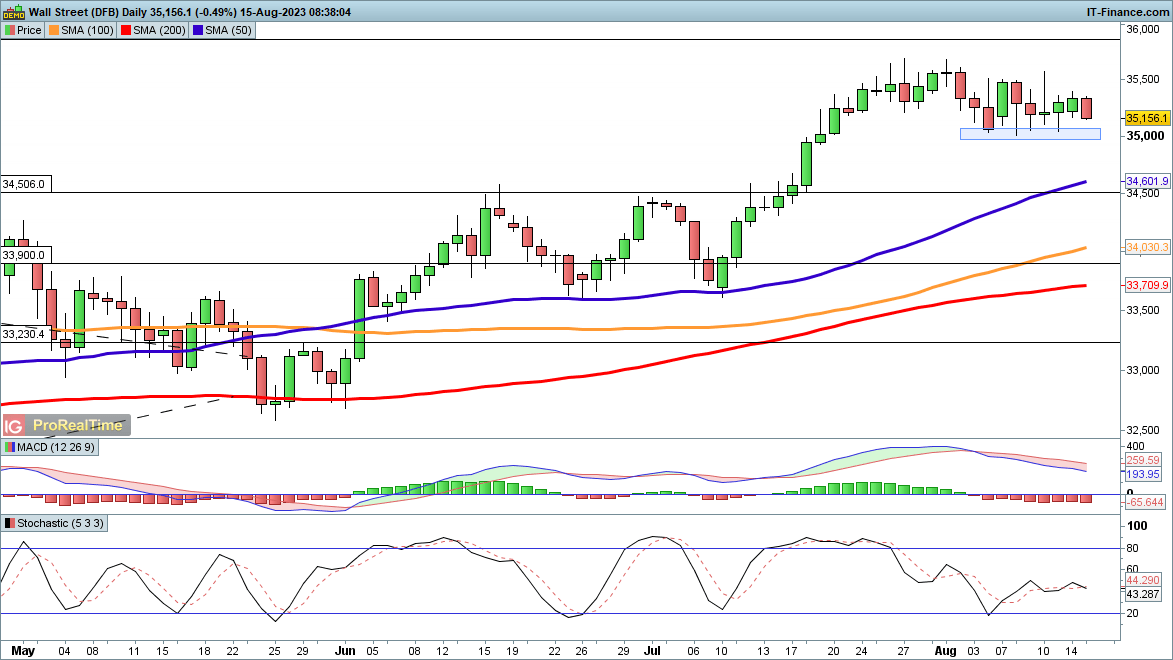
Two days of gains seemed to point towards renewed upside for the index, but futures are weaker this morning. So far losses have stemmed around 35,000, but a close below this would open the way to the 50-day SMA, currently a 34,602. Just below this is the 34,500 resistance level from June and July.
A close back above 35,400 might suggest that the buyers have wrested control back once more.
Dow Jones Daily Price Chart

See how daily and weekly changes in positioning can change the outlook of the Dow Jones
| Change in | Longs | Shorts | OI |
| Daily | 18% | -4% | 1% |
| Weekly | 38% | -20% | -9% |
Hang Seng slips despite policy easing
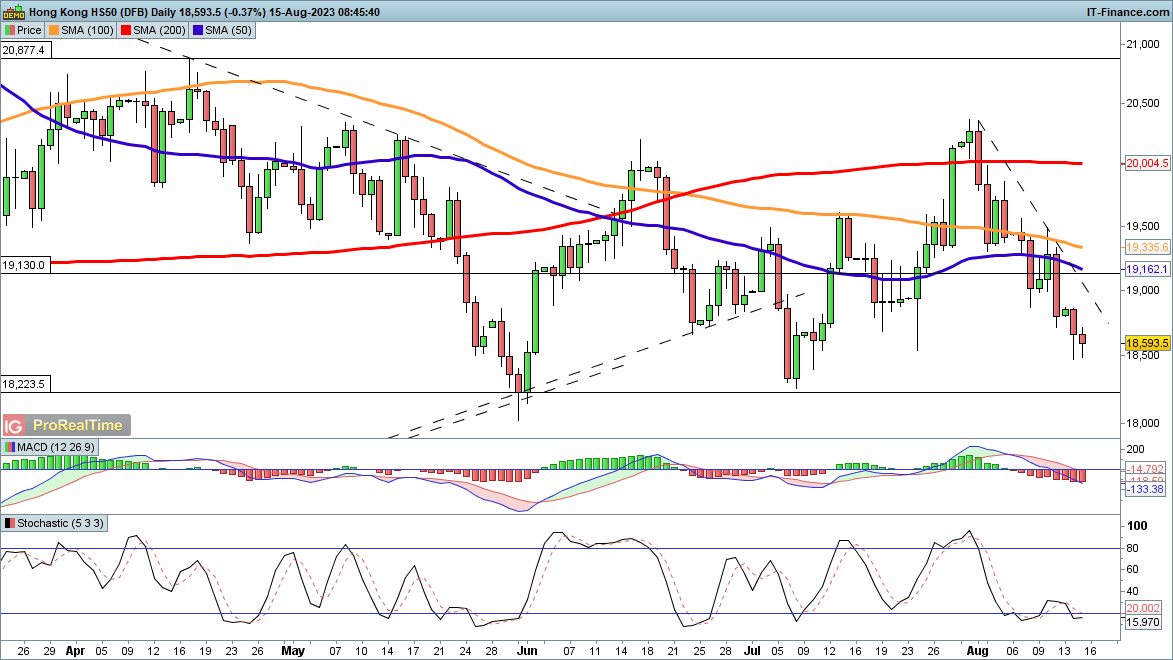
A bearish view continues in place here despite some loosening of monetary policy by the Chinese central bank. Sellers continue to drive the price lower, and the next target becomes the early July low at 18,280. Just below this is the May low at 18,230.
A break of this level opens the way to eroding some more of the November and December gains from 2022. Buyers will need a close back above 19,000 to suggest that a low is in place.
Hang Seng Daily Price Chart

Recommended by IG
Traits of Successful Traders

Leave a Reply