Article by IG Chief Market Analyst Chris Beauchamp
FTSE 100, DAX $0, Dow Jones Analysis and Charts
FTSE 100 finds support at 7500
The previous three sessions have seen the index dip to 7500, but buyers have come in to defend this level each time. This leaves open the possibility of a renewed move back to 7700, and then on to the highs of May around 7800. So long as 7500 holds then the bullish view could still recover its pre-eminence.
A close below 7450 would be bearish, and open the way to a move to the July lows around 7200.
FTSE 100 Daily Chart
Recommended by IG
Traits of Successful Traders
Dax 40 holds 15,700 again
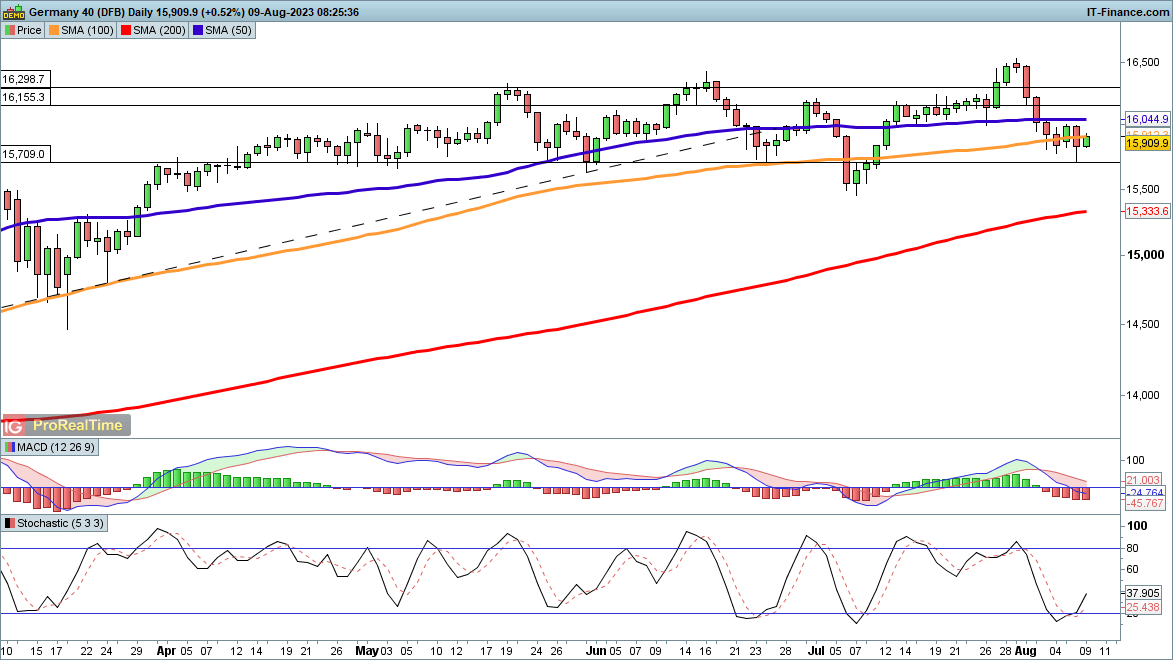
The declines appear to have stabilised for now, and the 15,700 level continues to hold as support. A close back above 16,000 might signal a new move higher has begun, allowing the index to target the recent record highs and then move higher.
A close below 15,700 brings 15,500 and then the 200-day SMA into view.
Dax 40 Daily Price Chart

Introduction to Technical Analysis
Candlestick Patterns
Recommended by IG
Dow Jones steady after Tuesday rebound
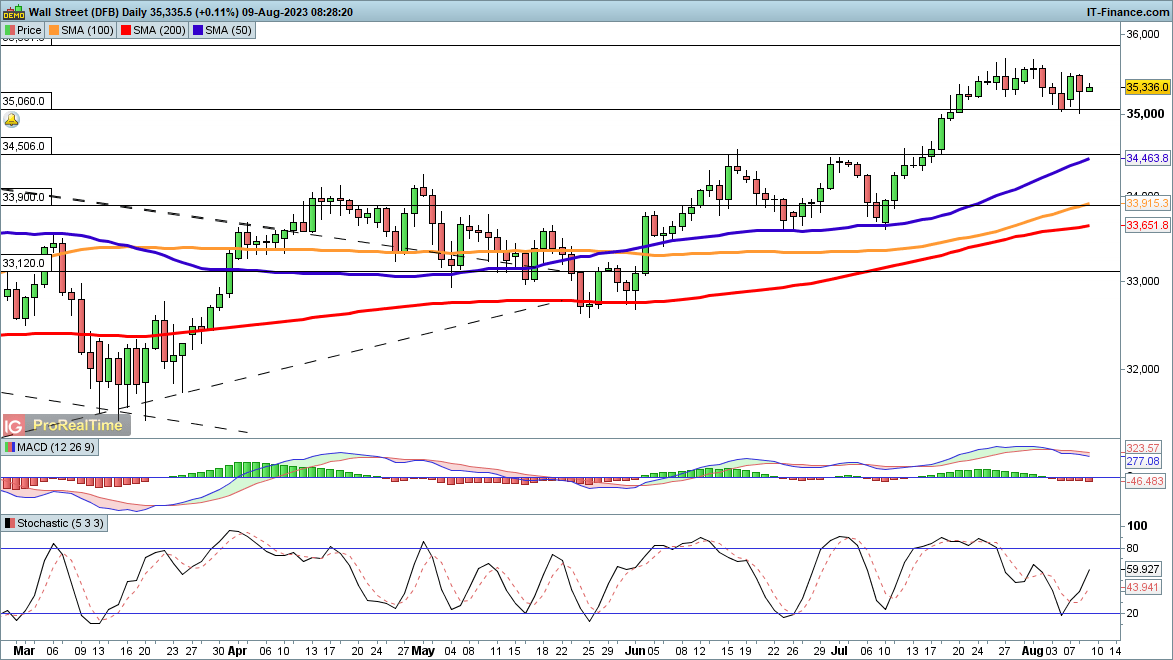
Tuesday saw the index rebound from its lows, though as yet there has been little follow-through in early trading. Most of the gains from the lows of June are still intact. A close back above 35,500 could put the buyers in charge once again, and then open the way to 35,860, last seen in February 2022.
A close below 35,000 could provide the catalyst for a move back to the 50-day SMA.
Dow Jones Daily Chart


Leave a Reply