Article by IG Chief Market Analyst Chris Beauchamp
FTSE 100, DAX 40, Dow Jones, Prices and Analysis
FTSE 100 tries to hold around 50-day MA
After Thursday’s drop, the index saw an attempt at a recovery on Friday.Modest gains so far this morning have helped to stabilize the picture and could see additional upside towards 7700. A close above 7700 would add to the bullish view and provide the possibility of a more sustained rally towards 7800.
Sellers will want to see a drop back below 7500 to negate this view and begin a possible retracement towards 7400 or lower.
FTSE 100 Daily Chart
Recommended by IG
Traits of Successful Traders
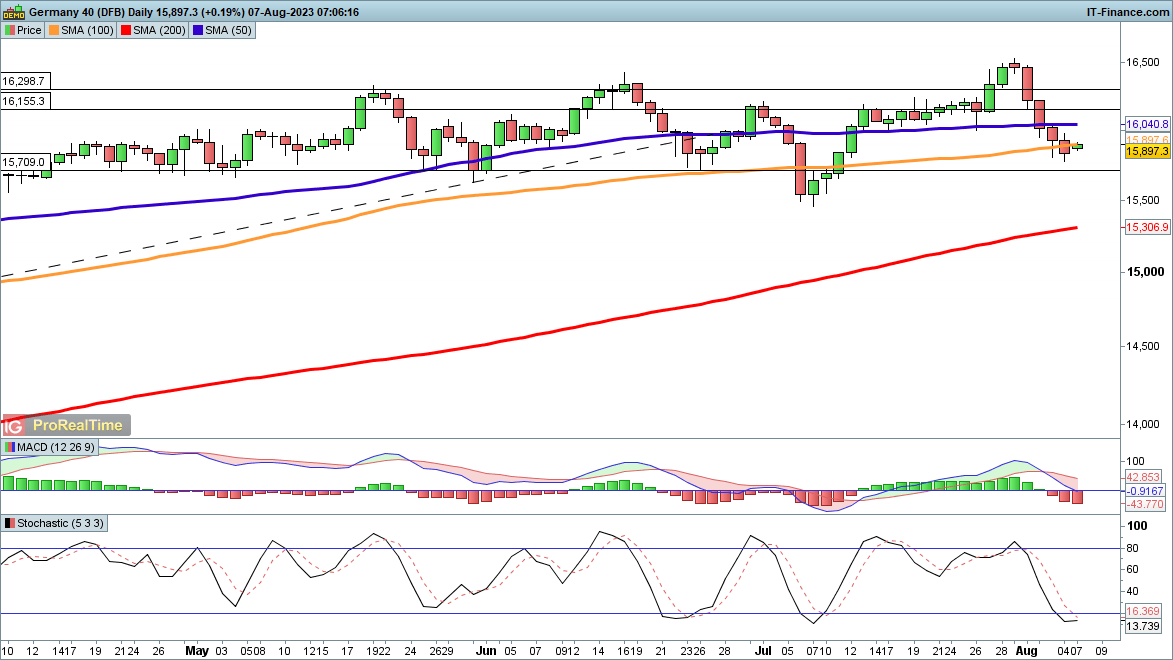
DAX 40 losses stabilise
Last week’s drop from the highs seems to have stabilised around the 100-day SMA. Additional losses target the 15,700 support zone, and then on to the July low at 15,500. Below this lies the rising 200-day SMA at 15,306.
A recovery above 16,000 might begin to suggest a new move higher has begun, targeting 16,300 and then the highs of late July at 16,500.
DAX 40 Daily Chart

Foundational Trading Knowledge
Macro Fundamentals
Recommended by IG
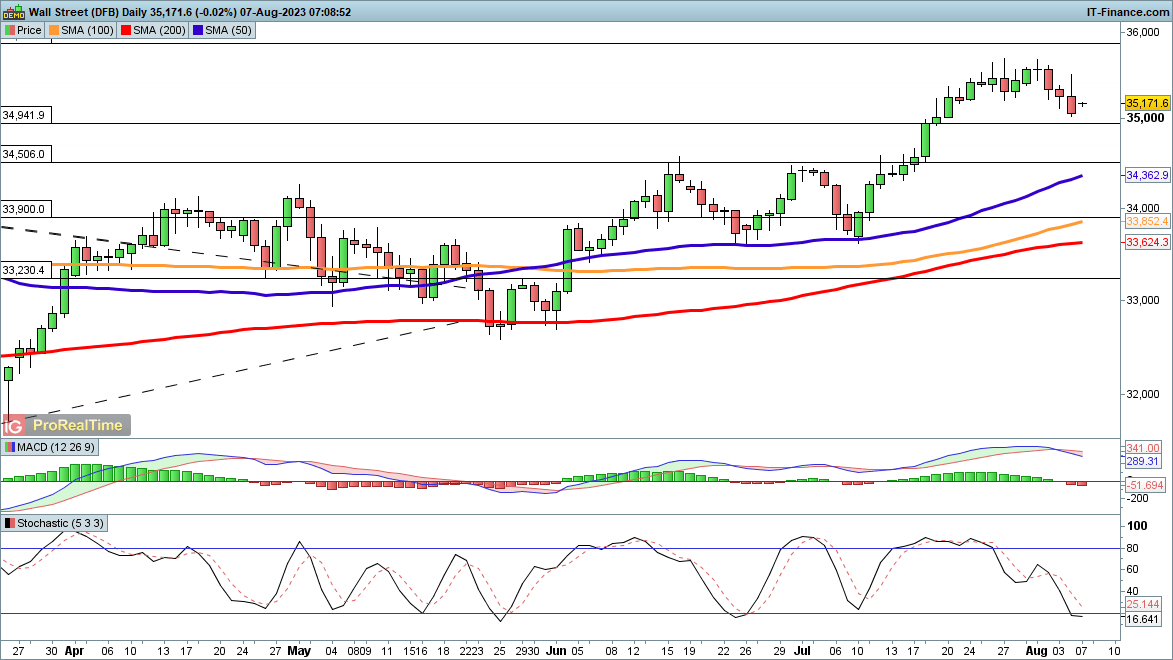
Dow Jones moves higher after Friday’s low
Friday saw the price hit a two-week low, though it is attempting to recover in early trading this morning.In the event of more losses, the December high at 34,942 comes into view, followed up by the 34,500 level that acted as resistance in June and July.
A recovery above 35,540 would be needed to suggest that a short-term low has formed.
Dow Jones Daily Chart


Leave a Reply