Article by IG Chief Market Analyst Chris Beauchamp
FTSE 100, DAX 40, Dow Jones Analysis, Prices and Charts
Recommended by IG
Traits of Successful Traders
FTSE 100 sheds more ground
The index fell back on Tuesday, once again unable to move above 7700. This could spell the beginning of a more substantial pullback. The 200-day SMA is now in view as possible support, while below this the early July level at 7562 comes into view. A move below 7500 would arguably revive a bearish view.
Buyers will want to see the index hold above 7550, and a recovery in due course that results in a daily close above 7700.
FTSE 100 Daily Price Chart
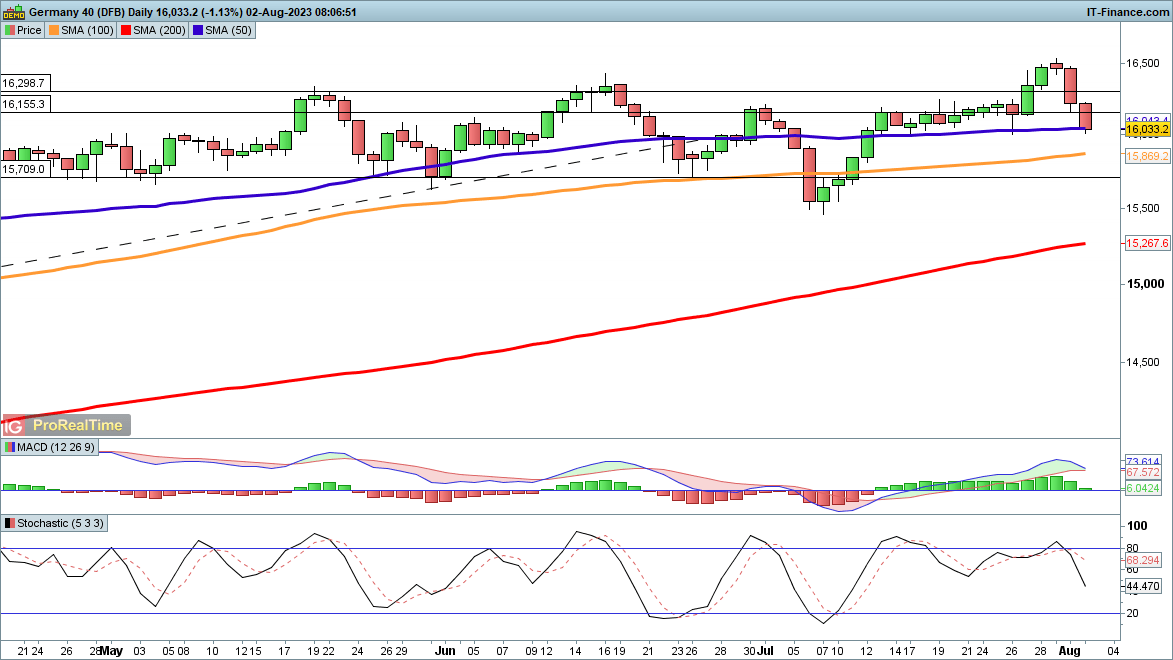
DAX 40 drops back to the 50-day moving average
After recording a new intraday high on Monday, the index has fallen back, with negative divergence on daily stochastics reinforcing the view that a wider decline may be imminent.The next target is the 16,000/50-day SMA area, which supported the index in mid-July. Below this 15,700 and then 15,500 come into view.
Buyers will want to see the index hold ideally above 16,000, or if not then above 15,700.
DAX 40 Daily Price Chart

Recommended by IG
Trading Forex News: The Strategy
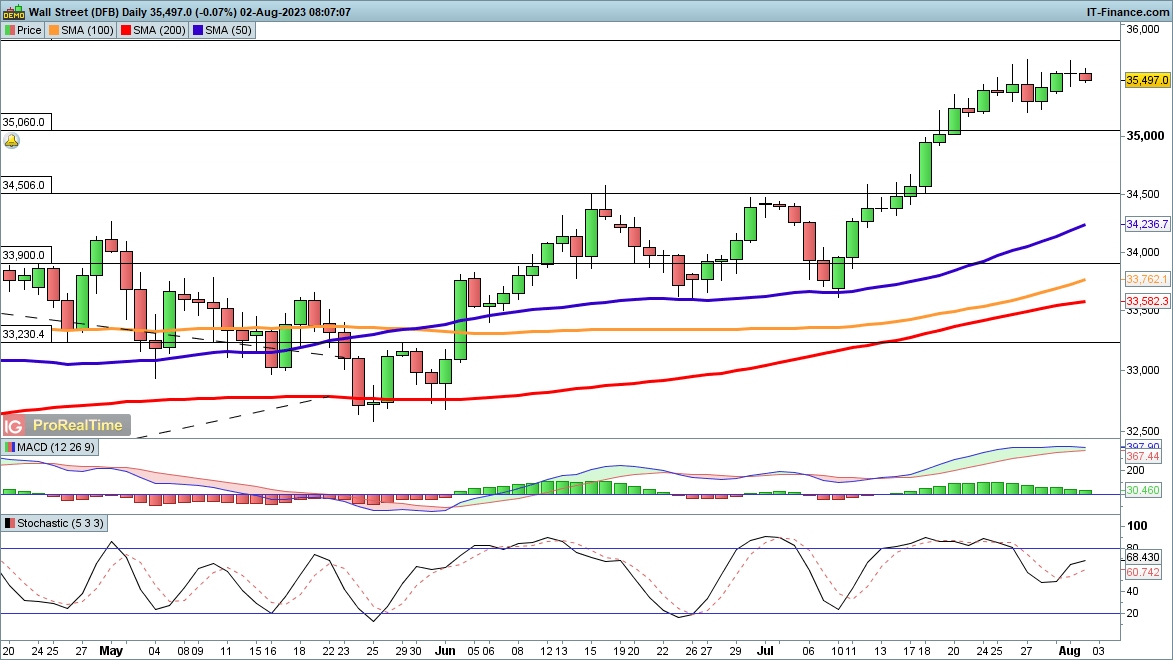
Dow Jones edges back from new 2023 high
News of a US downgrade did not appear to have much impact on the index, which continues to hold close to recent highs.Further upside continues to target 35,860, then on to 36,465 and then 36,954, this last being the record high from late 2021. It is important to note how overstretched the index is from the 50-day SMA – a pullback could see a drop of around 1500 points and leave the overall uptrend from the May lows intact.
Only a move below 33,670, the area of support of June and July, would mark a more bearish view.
Dow Jones Daily Price Chart


Leave a Reply