Article by IG Chief Market Analyst Chris Beauchamp
Dow Jones, Nikkei 225, Hang Seng Analysis and Charts
Recommended by IG
Building Confidence in Trading
Dow rallies once more
Monday saw the index rebound from the lows of the session, clawing back losses from the final two sessions of last week.A push to new record highs may well now develop, and beyond this the 38,000 level comes into view. This cancels out a short-term negative view and revives the uptrend, albeit at a potentially overextended level.
A reversal back below 37,250 would be needed to revive the short-term negative view.
Dow Jones Daily Chart
Nikkei 225 testing recent highs
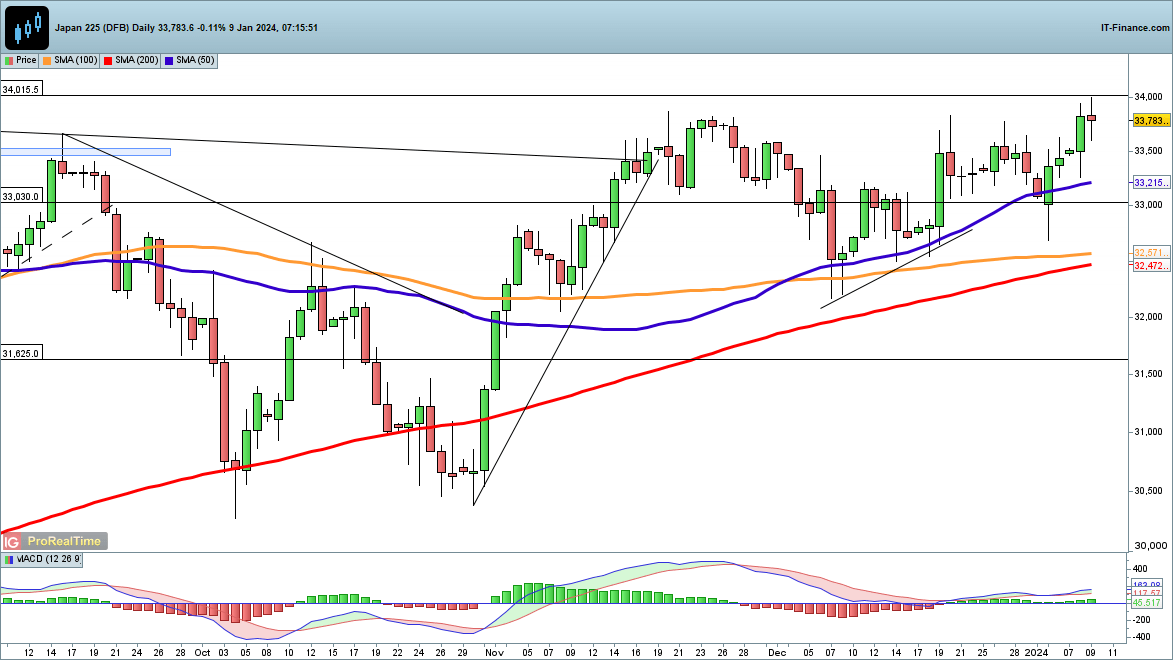
Further gains on Monday helped to lift the index back to the November highs, and now a test of 34,000 seems to beckon. A move above 34,000 would put the index at its highest levels since 1989 and would mark the end of the extended consolidation period for the index that has been in place since the end of June.
Since last week’s low the price has gained over 3%, and it would need a close back below 33,000 to put the sellers back in charge in the short-term.
Nikkei 225 Daily Chart

Recommended by IG
Traits of Successful Traders
Hang Seng back on a downward path
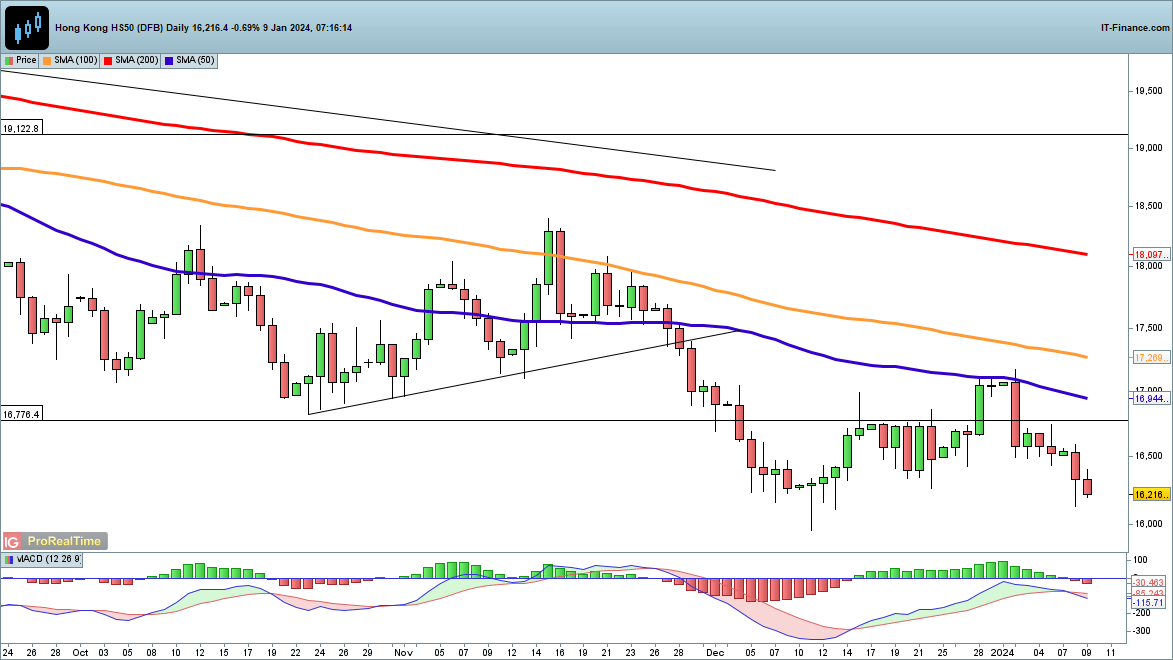
This index has resumed its downward move, after the brief rebound in late December. Gains faltered at the 50-day simple moving average (SMA), resulting in a textbook reversal that has taken the index back toward the December lows, the lowest level since November 2022. Further declines head towards the November low at 14,640.
A revival above the 50-day SMA and 17,170, the highs of last week, would be needed to suggest a short-term rebound has begun.
Hang Seng Daily Chart


Leave a Reply