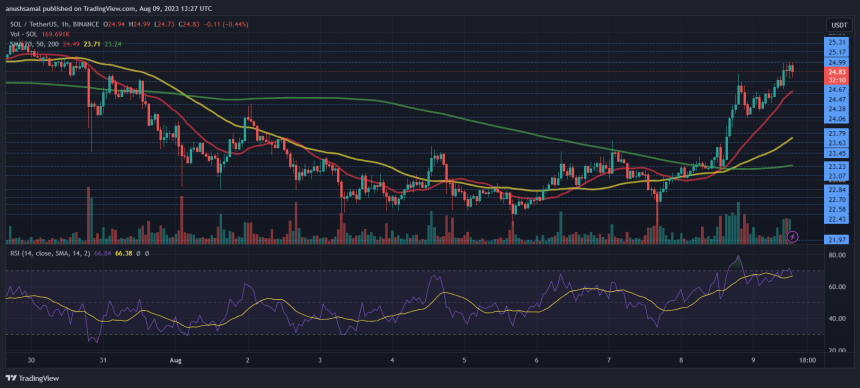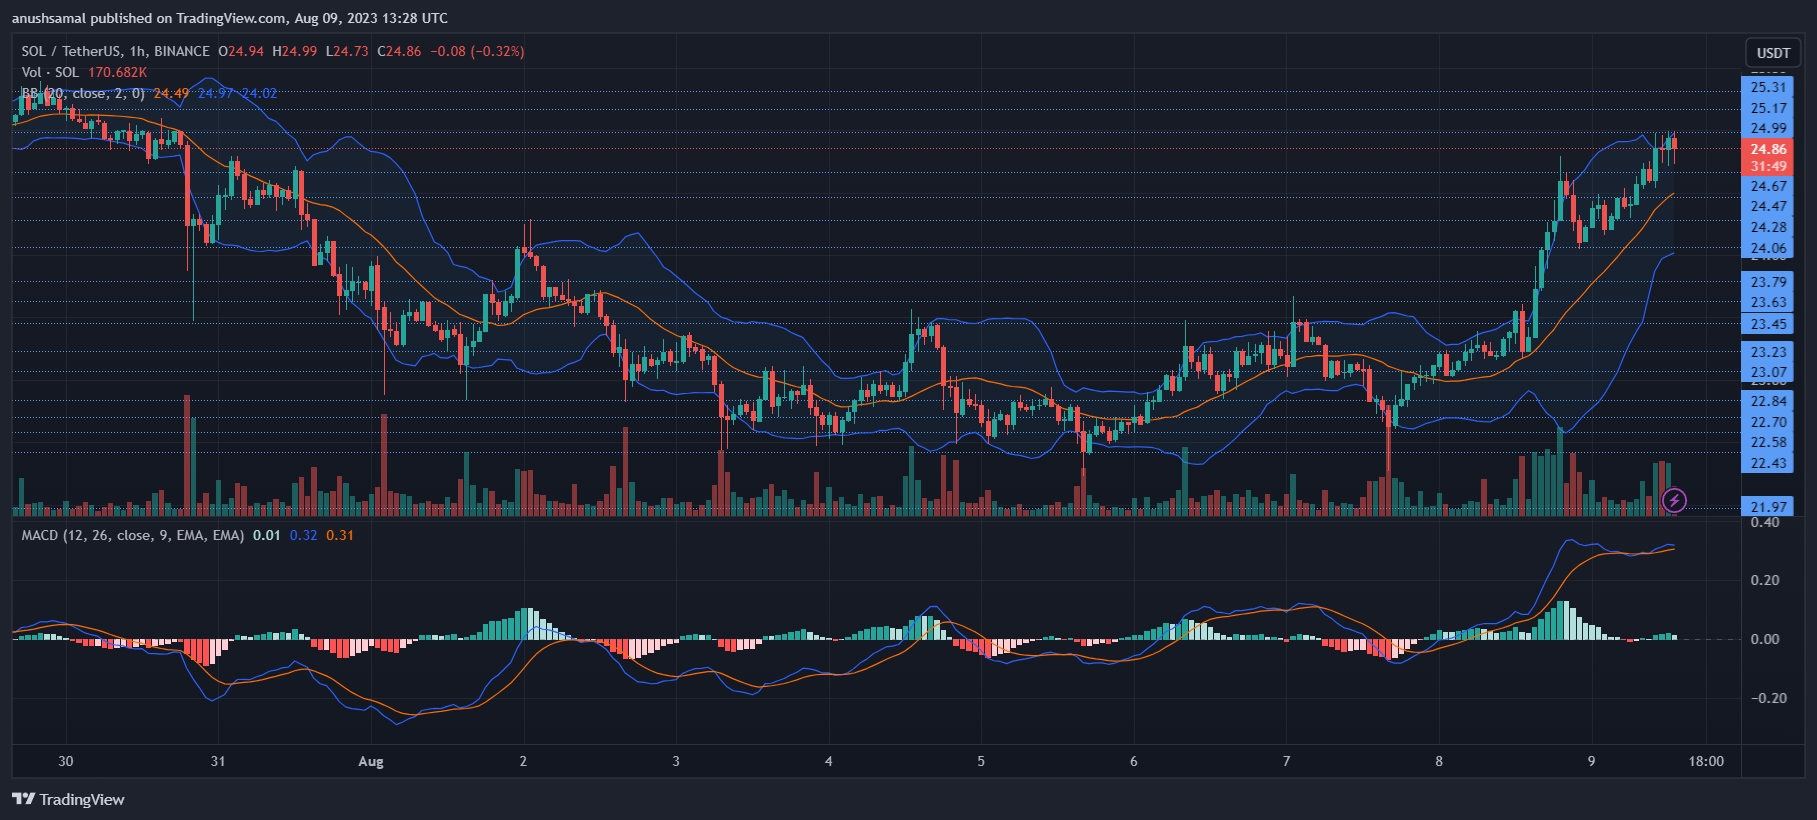
The Solana price exhibited a bullish trend during the recent trading session, pushing it beyond the $24 mark. It surpassed a key resistance hindering its progress for over a week. Within the last 24 hours, SOL saw a rise of around 6%, with a similar price increase visible on the weekly chart.
From a technical standpoint, Solana’s outlook appears optimistic following the recent price shift. Both demand and accumulation have expanded on the daily chart, reflecting positive sentiment.
Despite bullishness, the speed of SOL’s recovery depends on its ability to swiftly overcome the immediate barrier, which had previously acted as a tough resistance level.
Additionally, the bulls must ensure that the price remains above the local support, as a drop below would invalidate the bullish thesis. Furthermore, Solana’s market capitalization has improved, indicating a gradual inflow of buyers into the market now.
Solana Price Analysis: One-Day Chart
Trading at $24.84, SOL has successfully breached the $23 resistance level, marking a growth of nearly 6%. This upward movement has reignited buyer interest, yet for Solana’s recovery to persist, it must exceed the $25 threshold. Breaking past this point would enable the bulls to advance by an additional 8%, with a potential target of $27.
Conversely, the primary support levels for this altcoin are situated at $24 and subsequently at $22. A drop below $22 would revive bearish momentum, possibly prolonging a bearish phase.
Technical Analysis

As Solana surpassed the $23 level, there was a surge in demand for the coin, leading to an overbought condition. The Relative Strength Index rested just below the 70 mark, indicating a predominance of buyers in the market.
Similarly, SOL maintained its position above the 20-Simple Moving Average line, indicating buyers were steering the price momentum. Notably, Solana was also above the 200-SMA (green) line, signifying a state of bullishness.
Despite its bullish trajectory, the potential for a price pullback cannot be dismissed, considering that SOL was still near the overbought zone.

Aligned with the heightened demand, SOL has generated buy signals on the chart. The Moving Average Convergence Divergence (MACD), responsible for gauging price momentum and shifts, has given rise to these green histograms.
These histograms correspond to buy signals, suggesting that the price might experience a rise before a corrective phase ensues.
The Bollinger Bands, reflecting volatility, displayed significant widening, implying potential price fluctuations. However, these bands have also curved and ascended, pointing to an impending northward movement in the upcoming trading sessions.
Featured image from Bloomberg, charts from TradingView.com

Leave a Reply