Article written by Axel Rudolph, Senior Market Analyst at IG
USD/JPY puts pressure on its 10-month high
There is no stopping USD/JPY’s advance as the US dollar is on track for its tenth consecutive week of gains amid the Federal Reserve’s (Fed) hawkish pause while the Bank of Japan (BOJ) rigorously holds onto its dovish stance. The central bank stuck to its short-term interest rate at -0.1% and that of the 10-year bond yields at around 0% at this morning’s monetary policy meeting.
USD/JPY is fast approaching its 10-month high at ¥148.46, made on Thursday. A rise above this level would put the ¥150.00 region back on the cards, around which the BOJ may intervene, though.
Immediate upside pressure will be maintained while USD/JPY stays above its July-to-September uptrend line at ¥147.51 and Thursday’s low at ¥147.33. While this minor support area underpins, the July to September uptrend remains intact.
USD/JPY Daily Chart
Source: IG
Japanese CPI data and the BoJ decision earlier this morning sees USD/JPY trade higher. Find out what else affects this unique currency pair in the comprehensive guide below:
Recommended by IG
How to Trade USD/JPY
GBP/JPY tries to recover from six-week lows
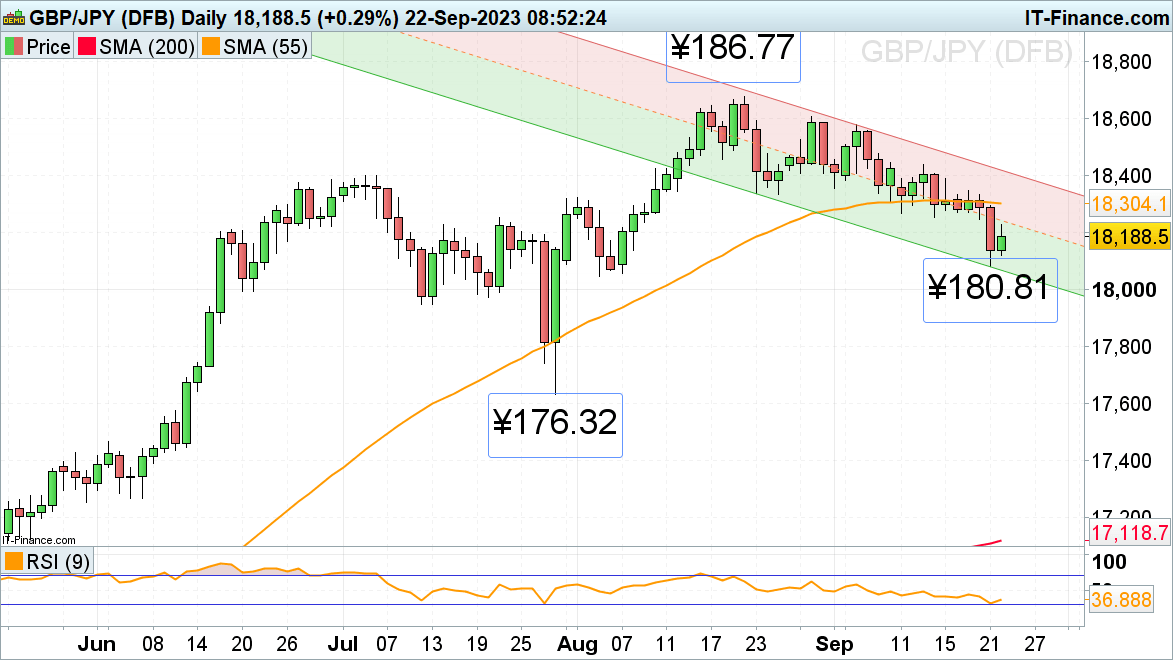
GBP/JPY accelerated to the downside as the BOE kept its rates steady at Thursday’s monetary policy meeting and hit a six-week low at ¥180.81, close to the August low at ¥180.46.
On Friday the cross is trying to bounce off the ¥180.81 low as the BOJ also kept its rates unchanged and reiterated its dovish stance while the annual inflation rate in Japan edged down to 3.2% in August, its lowest in three months.
Good resistance can be spotted between the mid-September low at ¥182.52 and the 55-day simple moving average (SMA) at ¥183.04.
GBP/JPY Daily Chart

Source: IG
Discover the #1 mistake traders make and avoid it! Read the findings of our analysis into thousands of live trades below:
Recommended by IG
Traits of Successful Traders
GBP/USD trades in six-month lows
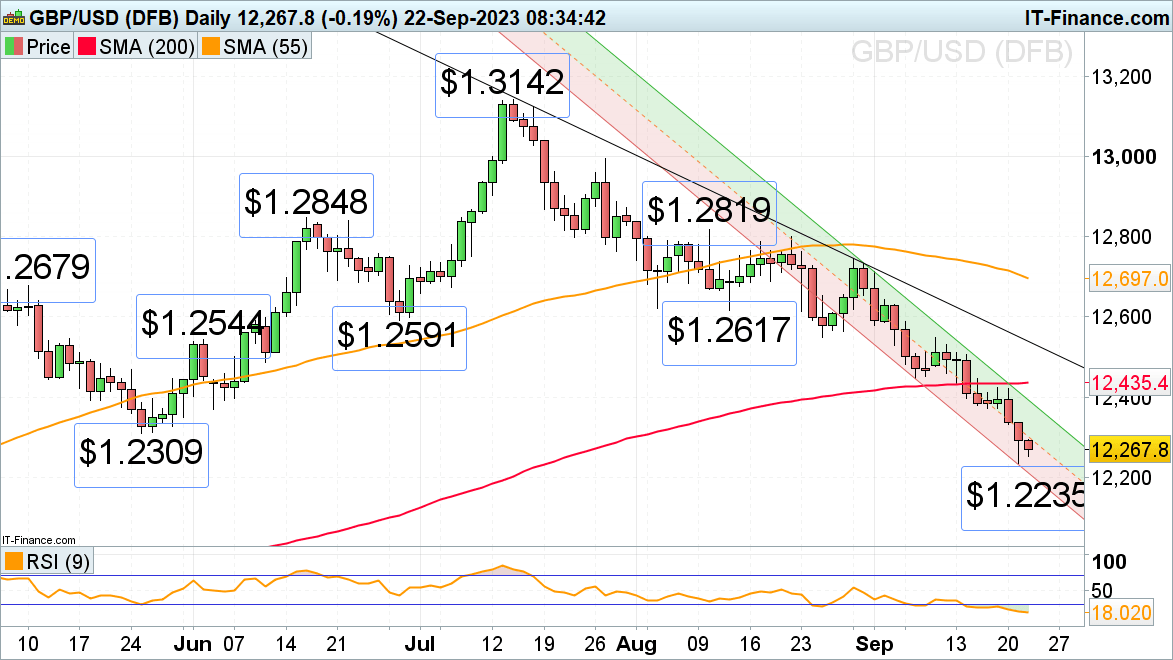
Following the Bank of England’s (BOE) decision to keep rates steady at 5.25% the British pound continued its descent to six month lows versus the greenback.
A fall through Thursday’s $1.2235 low would target the mid-March high and 24 March low at $1.2004 to $1.2191.
Minor resistance now sits at the $1.2309 May low and significantly further up along the 200-day simple moving average (SMA) at $1.2435. While remaining below it, the bearish trend stays firmly entrenched.
GBP/USD Daily Chart

Source: IG
Trade Smarter – Sign up for the DailyFX Newsletter
Receive timely and compelling market commentary from the DailyFX team
Subscribe to Newsletter

Leave a Reply