On-chain data shows the Bitcoin exchange whale ratio has spiked, a sign that the whales may be selling now.
Bitcoin Exchange Whale Ratio Has Gone Up In Recent Days
An analyst in a CryptoQuant post explained that the whale inflows have been higher than usual recently. The “exchange whale ratio” is an indicator that measures the ratio between the sum of the top 10 inflows to exchanges and the total exchange inflows.
Generally, the ten most significant transactions going to exchanges are coming from the whales, so this ratio’s value can provide hints about how the inflow activity of these humongous investors currently compares with the entire market.
When the value of this metric is high, it means that this cohort is making up a significant part of the total market inflows. As one of the main reasons investors deposit their coins to these platforms is for selling-related purposes, this trend can be a sign that the whales are currently applying a large amount of selling pressure.
On the other hand, low values imply the whales are making up for a relatively healthy portion of the total inflows. Depending on other market factors, such a trend may be neutral or bullish for the cryptocurrency’s price.
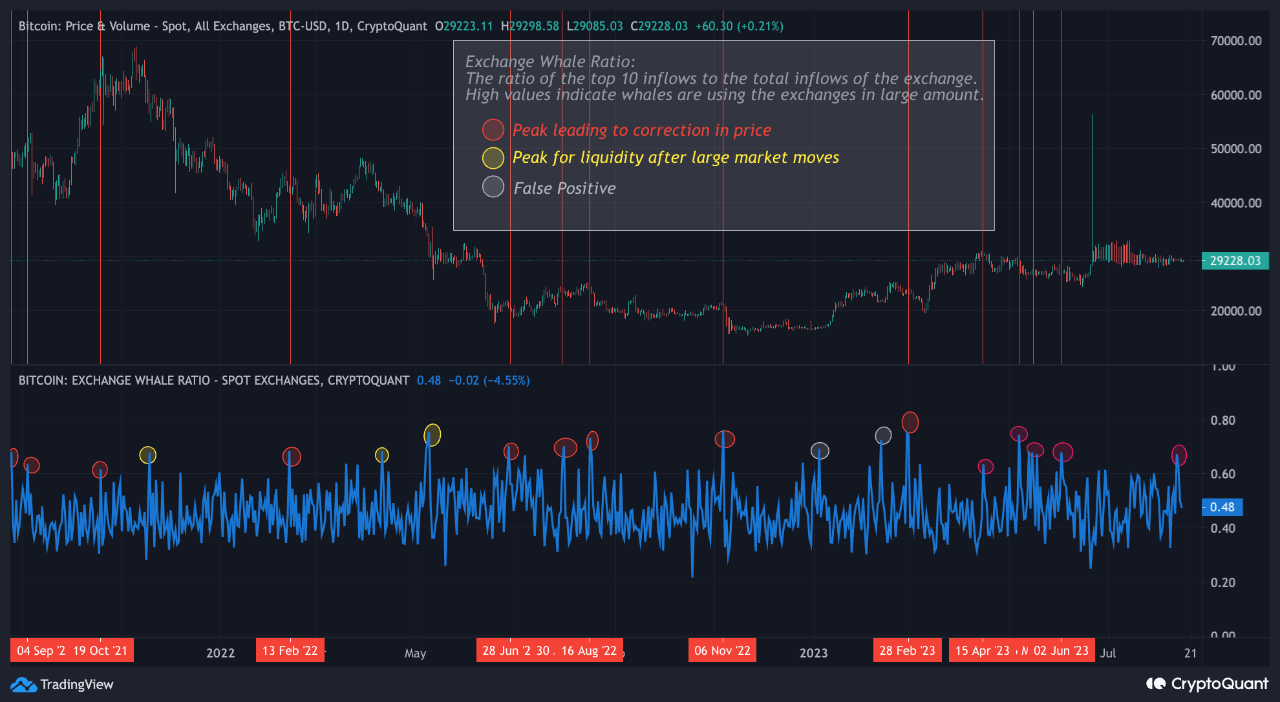
Now, here is a chart that shows the trend in the Bitcoin exchange whale ratio over the last couple of years:
The value of the metric seems to have hit a high peak in recent days | Source: CryptoQuant
The above graph shows that the Bitcoin exchange whale ratio has recently registered a spike. In this latest surge, the metric had neared the 0.70 mark, implying that almost 70% of the total exchange inflows had come from these humongous investors alone.
If these whales have made these deposits to sell their coins, then BTC could naturally feel a bearish effect from this inflow activity. So far, however, the price hasn’t seen any significant decline, as it continues to be within the range it has been endlessly consolidating for the past few weeks.
In the chart, the quant has also highlighted the instances during the last couple of years where the Bitcoin exchange whale ratio spiked to similarly high values.
It would appear that the BTC price declined shortly after most of these occurrences. In some instances, the bearish effect only occurred with a delay, meaning that even though the recent spike hasn’t led to a significant price drawdown, it could still do so soon.
It remains to be seen how the Bitcoin market copes with this potential high selling pressure from the whales this time.
BTC Price
At the time of writing, Bitcoin is trading around $29,000, down 2% in the last week.
Looks like BTC has continued to move sideways recently | Source: BTCUSD on TradingView
Featured image from Todd Cravens on Unsplash.com, charts from TradingView.com, CryptoQuant.com

Leave a Reply