Article written by IG Chief Market Analyst Chris Beauchamp
Dow Jones, Nasdaq 100, Hang Seng – Analysis, Prices, and Charts
Recommended by IG
How to Trade FX with Your Stock Trading Strategy
Dow Jones tries to build on Friday’s gains
After surging on Friday the index has run into resistance around 33,800. If buyers can step in above the 50-day SMA then a more bullish view may yet prevail; indeed this might remain the case even if the price drops back towards 33,200.
Further upside above 33,800 opens the way to 34,200 and the highs from early May, while beyond this the January and February highs around 34,345 beckon.
Sellers will want to see a drop back below 33,200 to set up another potential test of the 200-day SMA and the May lows around 32,600.
Dow Jones Daily Price Chart – June 6, 2023
Trade Smarter – Sign up for the DailyFX Newsletter
Receive timely and compelling market commentary from the DailyFX team
Subscribe to Newsletter
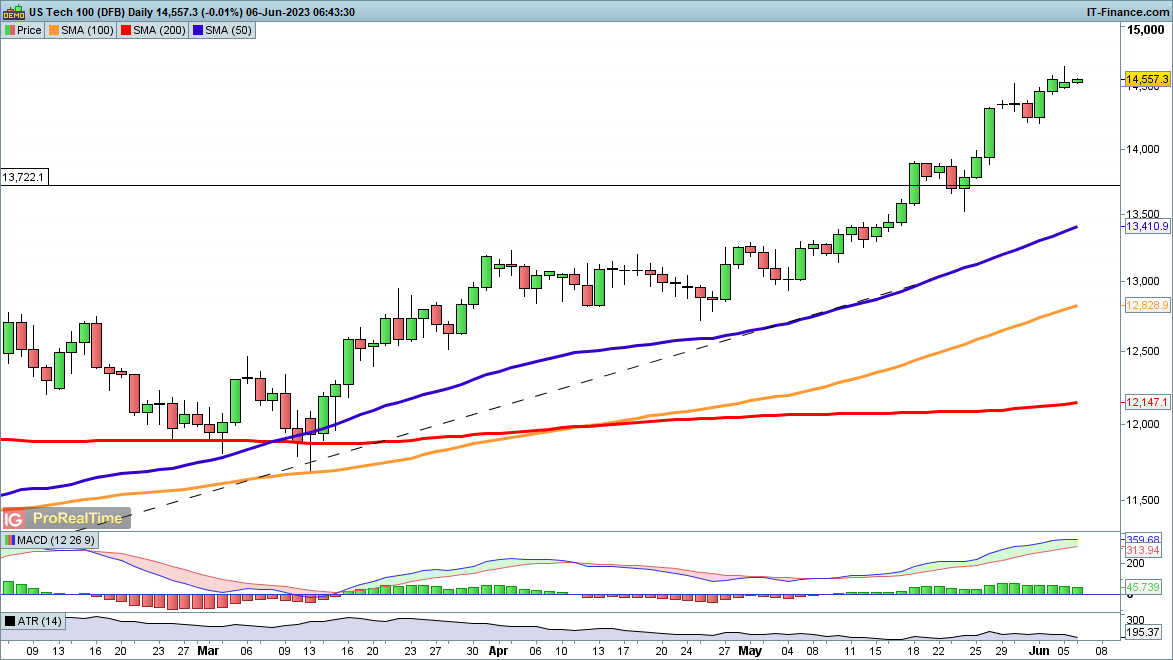
Nasdaq 100 hits new one-year high
While other indices faltered on Monday this index made a fresh one-year high, buoyed by euphoria around AI stocks.
The steady gains from late April remain in place, with around 1800 points added to the index in that time. The index shows no sign of reversing or even consolidating for now. For this to occur we would need to see a drop back below 14,200 and then on below 14,000.
March 2022’s highs around 15,230 continue to be the next target if the index continues to make headway.
Nasdaq 100 Daily Price Chart – June 6, 2023

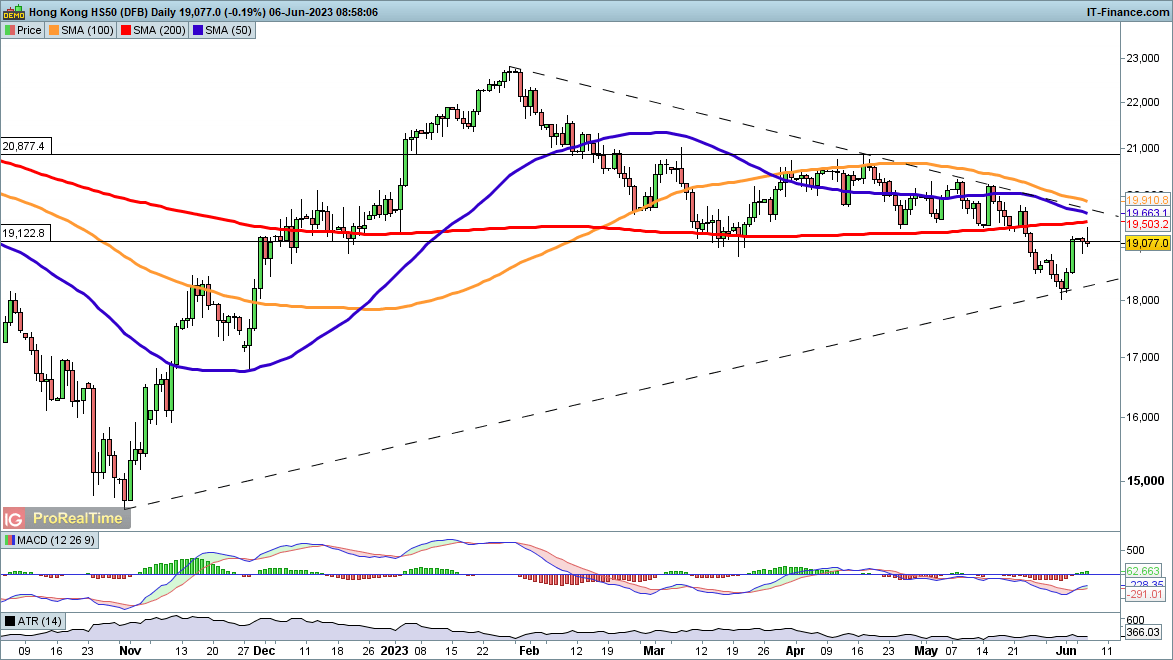
Hang Seng struggles to hold gains
The index rebounded from a six-month low last week, and may have established a new trendline from the October 2022 lows.
However, little further upside has been seen since last week’s surge, leaving the index below the 200-day SMA. It has been able to move above 19,000 a key area of support in December 2022 and in March 2023.
A reversal back below 18,700 might flag another potential test of trendline support from the October 2022 lows, or a drop towards last week’s lows of 18,000.
Hang Seng Daily Price Chart – June 6, 2023


Leave a Reply